527.
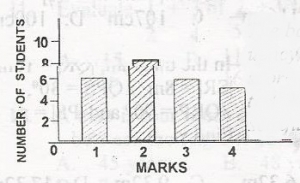

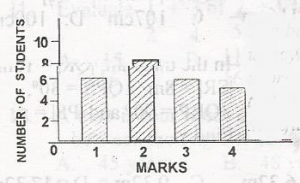
A.
10
B.
24
C.
25
D.
30
Correct answer is C
6 + 8 + 6 + 5 = 25
530.
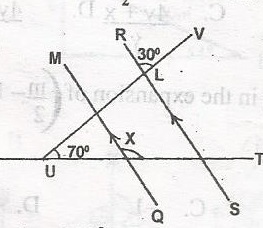

In the diagram, MQ//RS, < TUV = 70o and < RLV = 30o. Find the value of x
A.
150o
B.
110o
C.
100o
D.
95o
Correct answer is C
L + 30o - 180o(Sum of < s on straight line)
L = 180o - 30o = 150o
L = q = 150o(opposite < s are equal)
y = b = 30o(alt. < s)
b + c = 180o(sum of < s on str. line)
30o + c 180
c = 180 - 30
c = 150o
b = a = 30o (opp < s are equal)
c = d = 150o (opp < s are equal)
a + k + 70o = 180o (sum of < s on △)
30o + k + 70o = 180
k + 100o = 180
k = 180 - 100
k = 80o
x + 80o = 180(sum of < s on straight line)
x = 180o - 80o
x = 100o
WAEC Subjects
Aptitude Tests
