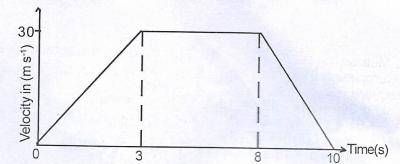
The diagram above is a velocity- time graph of a moving o...

The diagram above is a velocity- time graph of a moving object. Calculate the distance travelled when the acceleration is zero.
300 m
90 m
150 m
210 m
Correct answer is C
The acceleration is between the times 3 secs and 8 secs.
Distance = \(velocity \times time\)
= \(30 \times (8 - 3) = 30 \times 5\)
= \(150 m\)
Similar Questions
Given that M = \(\begin{pmatrix} 3 & 2 \\ -1 & 4 \end{pmatrix}\) and N = ...
If \(P = {x : -2 < x < 5}\) and \(Q = {x : -5 < x < 2}\) are subsets of \(\mu = {x : -5 ...
If \(\begin{vmatrix} k & k \\ 4 & k \end{vmatrix} + \begin{vmatrix} 2 & 3 \\...
A fair die is tossed 60 times and the results are recorded in the table Number of die 1 2 ...
A particle is acted upon by two forces 6N and 3N inclined at an angle of 120° to each other. Fin...
Express the force F = (8 N, 150°) in the form (a i + b j) where a and b are constants ...
Calculate, correct to one decimal place, the angle between 5 i + 12 j and -2 i + 3 j ...