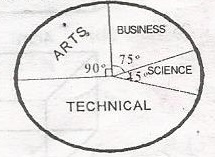
100
150
200
250
Correct answer is D
Arts = 90o business = 75o, science = 45o
Technical 360o - (90o - 75o + 45o) = 360o - 210o
Technical = 150o
textbooks for technical class = \(\frac{150^o}{360^o}\) x 600
= 250
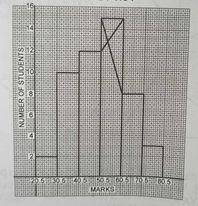
Using the histogram, what is the median class?
60.5 - 70.5
50.5 - 60.5
40.5 - 50.5
30.5 - 40.5
Correct answer is C
No explanation has been provided for this answer.
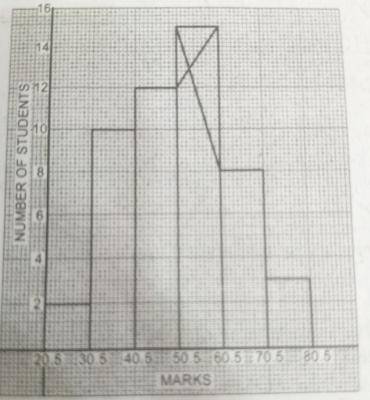
Using the histogram, estimate the mode of distribution
51.5
52.5
53.5
54.5
Correct answer is C
No explanation has been provided for this answer.
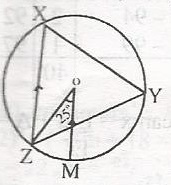
In the diagram, O is the centre of the circle. OM||XZ and < ZOM = 25º. Calculate ∠XYZ
50o
55o
60o
65o
Correct answer is D
Angle in a semi-circle is 90º when OM is subtended
: (90 - 25)º
= 65º
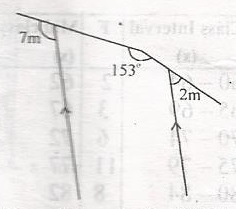
Find the value of m in the diagram
34o
27o
23o
17o
Correct answer is D
\(\bigtriangleup\) ABC, A + 153 = 180 (angles on straight line)
< A = 180 - 153 = 27
< B = 2m(vertically opposite angles)
< C = 7m (corresponding ngles)
< A + < B + < C = 180 (sum of int. angles of \(\bigtriangleup\))
i.e. 27 + 2m + 7m = 180o
9m = 180 - 27
9m = 153
m = \(\frac{153}{9}\)
= 17
WAEC Subjects
Aptitude Tests