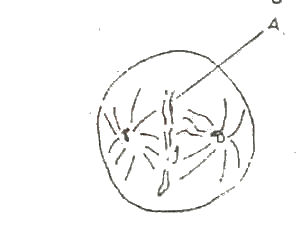
What stage is illustrated by the diagram?
lnterphase
Prophase
Metaphase
Anaphase
Telophase
Correct answer is C
No explanation has been provided for this answer.
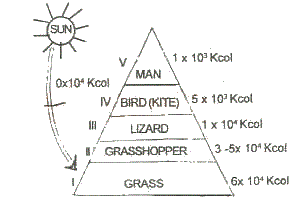
.10 x 104k cal obtained from the sun would decrease
10 x 104k cal obtained from the sun would increase
6 x 10⁴k cal obtained at level I would increase
1 x 10⁴k cal obtained at level V would increase
3.5x 10⁴k cal obtained at level II would increase
Correct answer is C
No explanation has been provided for this answer.
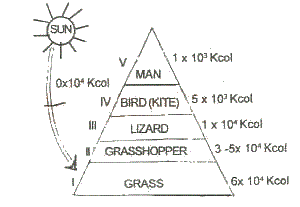
What phenomenon in ecosystem does the diagram illustrate?
Pyramid of numbers
Food web among organisms
Pyramid of energy
Pyramid of biomass
Evolutionary trend in organisms
Correct answer is C
No explanation has been provided for this answer.
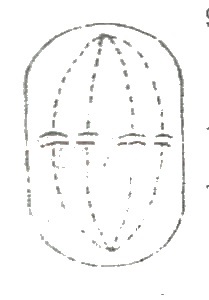
Which of the following processes is not evident from the drawing?
Lining up of the chromosomes at the equatorial plate
Centromere attaching a pair of chromatids to a spindle fibre
Chromatids held by centromere
Absence of nuclear membrane
Chromatids moving to the poles
Correct answer is C
No explanation has been provided for this answer.
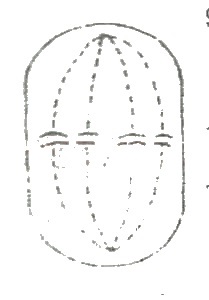
The stage of mitosis represented in the diagram is known as the
telophase
metaphase
anaphase
interphase
prophase
Correct answer is B
No explanation has been provided for this answer.
WAEC Subjects
Aptitude Tests