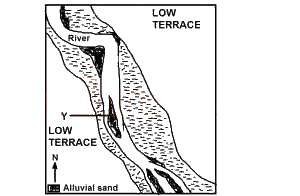
What pattern of flow did the river develop towards the southern edge of the mapped area?
Meandering
straight
Braiding
Radial
Correct answer is C
No explanation has been provided for this answer.
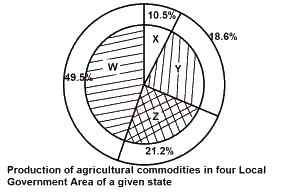
pie chart
chloropeth map
proportional graph
bar graph
Correct answer is A
No explanation has been provided for this answer.
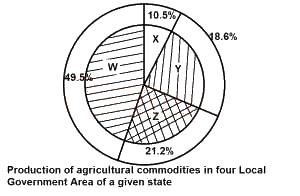
Express the agricultural production of Y in degrees.
57o
67o
37o
47o
Correct answer is B
No explanation has been provided for this answer.
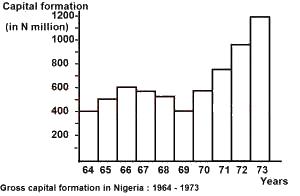
The histogram above shows a steady growth of gross capital formation occurred between
1967 and 1971
1964 and 1968
1969 and 1973
1966 and 1970
Correct answer is C
No explanation has been provided for this answer.
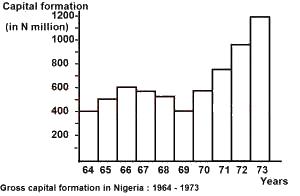
From the diagram above, the gross capital formation from 1964 t0 1966 was
N1500 million
N1200 million
N900 million
N150 million
Correct answer is A
No explanation has been provided for this answer.
JAMB Subjects
Aptitude Tests