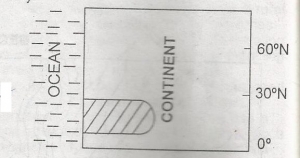
Identify the shaded natural region in the diagram
Tropical monsoon
Equatorial
Hot desert
Mediterranean
Tropical savannah
Correct answer is C
No explanation has been provided for this answer.
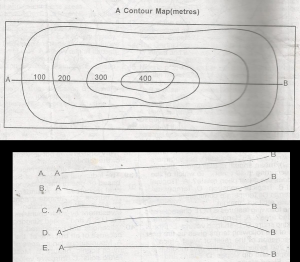
A
B
C
D
E
Correct answer is D
No explanation has been provided for this answer.
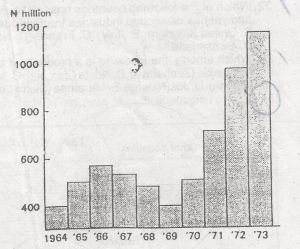
Gross capital formation in Nigeria 1964-1973, what can be inferred from the histogram above?
there was a steady growth of capital formation in the period
capital formation in the last two years exactly equalled those of all previous years combined
at the end of the period, Nigeria had become self-sufficient
Nigeria experienced serious economic problems during the period
Nigeria is one of the richest countries in Africa
Correct answer is B
No explanation has been provided for this answer.
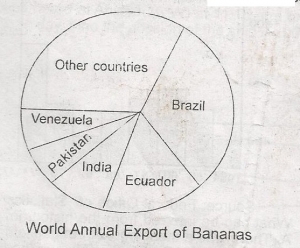
From the above diagram, Brazil's contribution to the export of bananas is
60%
50%
30%
20%
10%
Correct answer is C
No explanation has been provided for this answer.
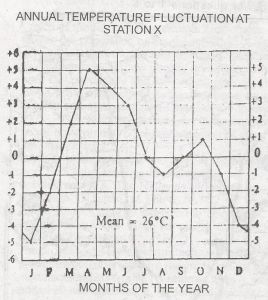
The annual range of temperature at Station X is
15oC
10oC
5oC
0oC
Correct answer is B
No explanation has been provided for this answer.
JAMB Subjects
Aptitude Tests