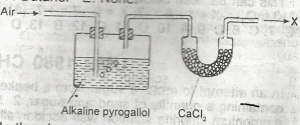
pure nitrogen
a mixture of nitrogen and oxygen
a mixture of nitrogen and carbondioxide
a mixture of oxygen and inert gases
a mixture of nitrogen and inert gases
Correct answer is E
Alkaline solutions of pyrogallol absorb oxygen efficiently and are used in determining the oxygen content of gas mixtures.
calcium chloride absorbs sufficient moisture/water from the air.
So,Nitrogen and Inert gases will be left

Which of the structural formal above is ethanoic acid is
A
B
C
D
E
Correct answer is E
Ethanoic acid is CH3COOH

2-methylbut-3-ene
2-methylbut-4-ene
3-methylbut-2-ene
3-methylbut-1-ene
3-methylpent-1-ene
Correct answer is D
No explanation has been provided for this answer.
NaOH solution by 70 cm3
NaOH solution, by 60 cm3
NaOH solution by 40 cm3
Al(NO3)3 solution by 20 cm3
Al(NO3)3 solution by 10 cm3
Correct answer is C
No explanation has been provided for this answer.
1.35g
1.00g
0.70g
0.65g
0.00g
Correct answer is A
\(Zn + H_2 SO_4 → ZnSO_4 + H_2\)
1 mole of Zn = 1 mole \(H_2SO_4\)
no of moles of \(H_2SO_4\) = C X V = 1 X 10/1000 = 0.01moles.
0.01mole \(H_2SO_4\) = 0.01 mole Zn
mass of Zn = 0.01 x 65(given) = 0.65g
therefore, the mass of undissolved Zn = 2.00(given) - 0.65 = 1.35g.
JAMB Subjects
Aptitude Tests