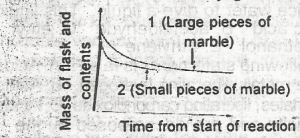
The following graph demonstrates the rate of reaction between calcium carbonate (marble)and dilute hydrochloric acid. The graph shows that the rate of reaction is initially greatest when
the initial slope of the curve is steepest and this occur when small pieces of marble are used and is due to a small surface area of reactant
the occur when large pieces of marble are used and is due to a small surface area of reactant
the initial slope of the curve is steepest and this occurs when small pieces of marble are used and is due to a large surface area of reactant
the initial slope of the curve is steepest and this occur when large surface area of reactant
the initial slope of the curve is least steep and this occur when small pieces of marble are used and is due to the increased surface area of the reactant
Correct answer is C
No explanation has been provided for this answer.
Similar Questions
CO(g) + H2O(g) → CO2g + H2(g) ΔH = -4100J. Which of the following f...
What is the chemical symbol for Hassium? ...
The condition required for corrosion to take place is the presence of ...
8g of CH4 occupies 11.2 at S.T.P. What volume would 22g of CH3CH2CH3 occupy...
The gasification of coke is used for the manufacturing of? ...
By what amount must the temperature of 200cm3 of Nitrogen at 27°C be increased to double th...
Detergents are manufactured with straight hydrocarbon chains so as to make them ...