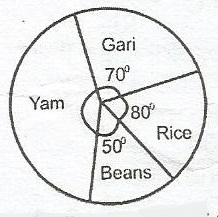
The pie chart above shows the monthly distribution of a m...

The pie chart above shows the monthly distribution of a man's salary on food items. If he spent N8,000 on rice, how much did he spent on yam?
N42,000
N18,000
N16,000
N12,000
Correct answer is C
Angle of sector subtended by yam
= 360o - (70 + 80 + 50)o
= 360o - 200o
= 160o
But \(\frac{80^o}{360^o}\) x T = 8000
T = \(\frac{8000 \times 360^o}{80^o}\)
= N36,000
Hence the amount spent on yam = \(\frac{160^o}{260} \times N36,000\)
= N16,000
Similar Questions
Solve the equations m2 + n2 = 29 m + n = 7 ...
If h(m+n) = m(h+r) find h in terms of m, n and r ...
P = {2, 1,3, 9, 1/2}; Q = {1,21/2,3, 7} and R = {5, 4, 21/2}. Find P∩Q∩R ...
4sin2 x - 3 = 0, find x if 0 \(\geq\) x \(\geq\) 90o...
Find the LCM of 23 x 3 x 52, 2 x 32 x 5 and 23 x 33 x 5...
Factorize m(2a-b)-2n(b-2a) ...
The length, in cm, of the sides of a right angled triangle are x, (x+2) and (x+1) where x > 0. Fi...
A sales boy gave a change of N68 instead of N72. Calculate his percentage error ...