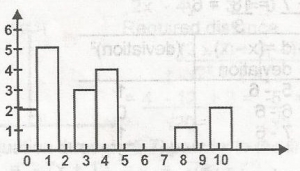
The bar chart shows the distribution of marks in a class ...

The bar chart shows the distribution of marks in a class test. How many students took the test?
A.
15
B.
20
C.
25
D.
30
Correct answer is B
Number f students that took the test = ∑f. Where f is the frequencies
= 2 + 5 + 0 + 3 + 4 + 0 + 0 + 2 + 3 + 1 + 2 = 20
Similar Questions
If cos θ = x and sin 60o = x + 0.5 0o < θ < 90o, find, correct to the nearest degr...
Find the determinant of the matrix A = \(\begin{pmatrix} 2 & 3 \\ 1 & 3&...
M varies directly as n and inversely as the square of p. If M = 3, when n = 2 and p =...
If x is negative, what is the range of values of x within which x+13 > \(\frac{1}{X +...
Write h in terms of a, b, c, d if a = b(1−ch)a−dh...