Mathematics questions and answers

Mathematics Questions and Answers

How good are you with figures and formulas? Find out with these Mathematics past questions and answers. This Test is useful for both job aptitude test candidates and students preparing for JAMB, WAEC, NECO or Post UTME.
1,241.
1,242.

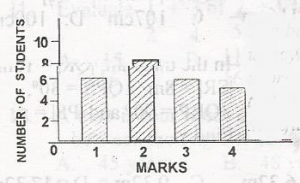
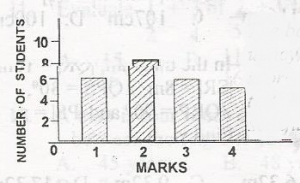
The bar chart shows the frequency distribution of marks scored by students in a class test. What is the median of the distribution?

A.

2

B.

4

C.

6

D.

8

Correct answer is A

median = (\(\frac{N + 1}{2}\))th = (\(\frac{25 + 1}{2}\))th

= \(\frac{26th}{2}\)

= 13th

the 13th is 2

1,243.

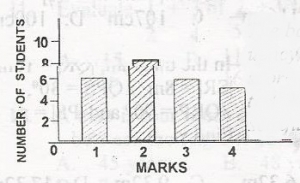
The bar chart shows the frequency distribution of marks scored by students in a class test. Calculate the mean of the distribution.

A.

6.0

B.

3.0

C.

2.4

D.

1.8

Correct answer is C

\(\begin{array}{c|c} x & f & fx\\ \hline 1 & 6 & 6 \\
2 & 8 & 16\\ 3 & 8 & 18\\ 4 & 5 & 20\end{array}\)

mean x = \(\frac{\sum fx}{\sum f}\)

= \(\frac{60}{25}\)

x = 2.4

1,245.

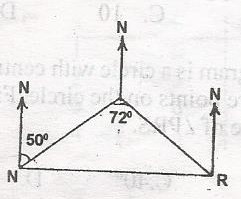
The position of three ships P,Q and R at sea are illustrated in the diagram. The arrows indicated the North direction. The bearing of Q from P is 050o and < PQR = 72o. Calculate the bearing of R and Q

A.

155o

B.

80o

C.

158o

D.

91o

Correct answer is C

< NPQ = < PQB = 50o(alt. < s)

< PQB = 50o

< PQR = < PQR < PQB + < QBR = 72o

< QBR = < PQR - < PQB = 72o - 50o

= 22o

< NQR = 180 - < QBR = 180o - 22 = 158o, the bearing of R from Q = 158o