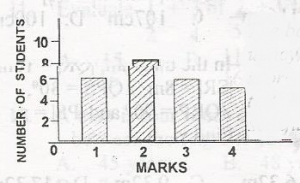
The bar chart shows the frequency distribution of marks s...

The bar chart shows the frequency distribution of marks scored by students in a class test. What is the median of the distribution?
2
4
6
8
Correct answer is A
median = (\(\frac{N + 1}{2}\))th = (\(\frac{25 + 1}{2}\))th
= \(\frac{26th}{2}\)
= 13th
the 13th is 2
Similar Questions
A binary operation \(\otimes\) is defined by \(m \otimes n = mn + m - n\) on the set of real nu...
\(\begin{vmatrix} -2 & 1 & 1 \\ 2 & 1 & k \\1 & 3 & -1 \end{vmatrix}\) = 23...
A coin is thrown 3 times. What is the probability that at least one head is obtained? ...
Find the value of X if \(\frac{\sqrt{2}}{x+\sqrt{2}}=\frac{1}{x-\sqrt{2}}\) ...
Simplify \(\frac{3^{-5n}}{9^{1-n}} \times 27^{n + 1}\)...
Find the volume of the cylinder above [Take \(\pi= ^{22}/_7\)] ...
If 2\(^{x + y}\) = 16 and 4\(^{x - y} = \frac{1}{32}\), find the values of x and y....