How good are you with figures and formulas? Find out with these Mathematics past questions and answers. This Test is useful for both job aptitude test candidates and students preparing for JAMB, WAEC, NECO or Post UTME.
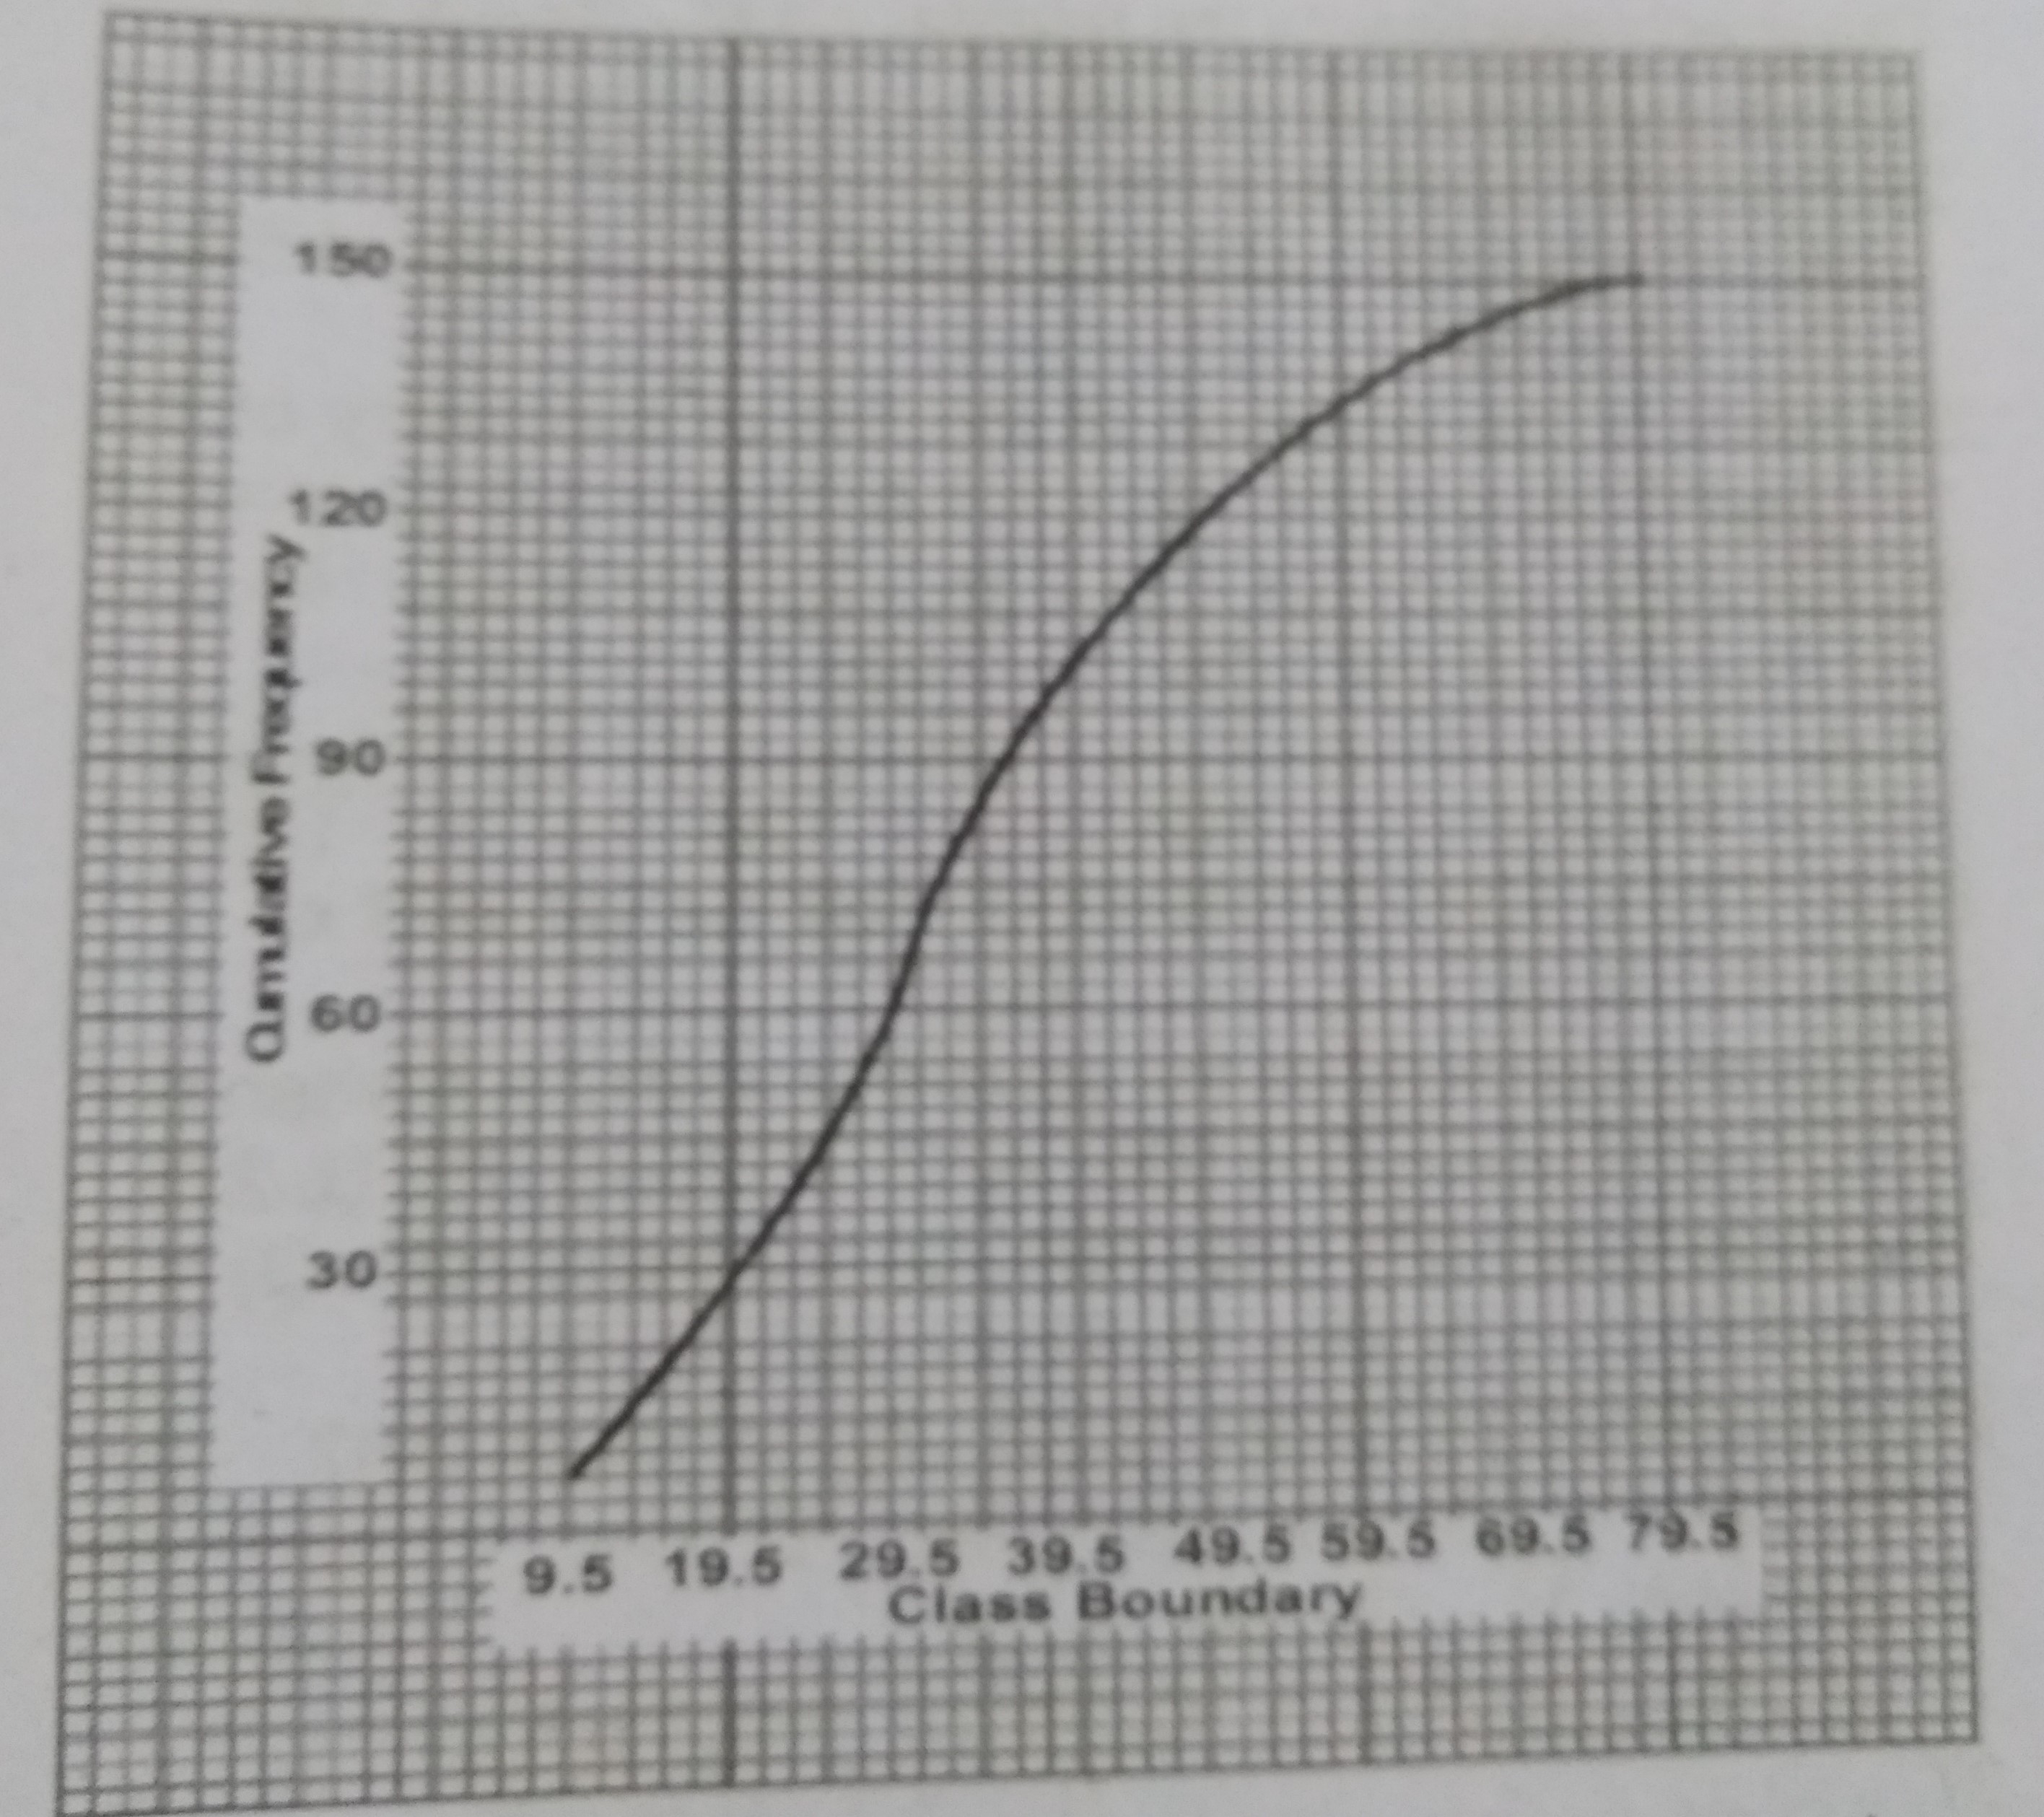
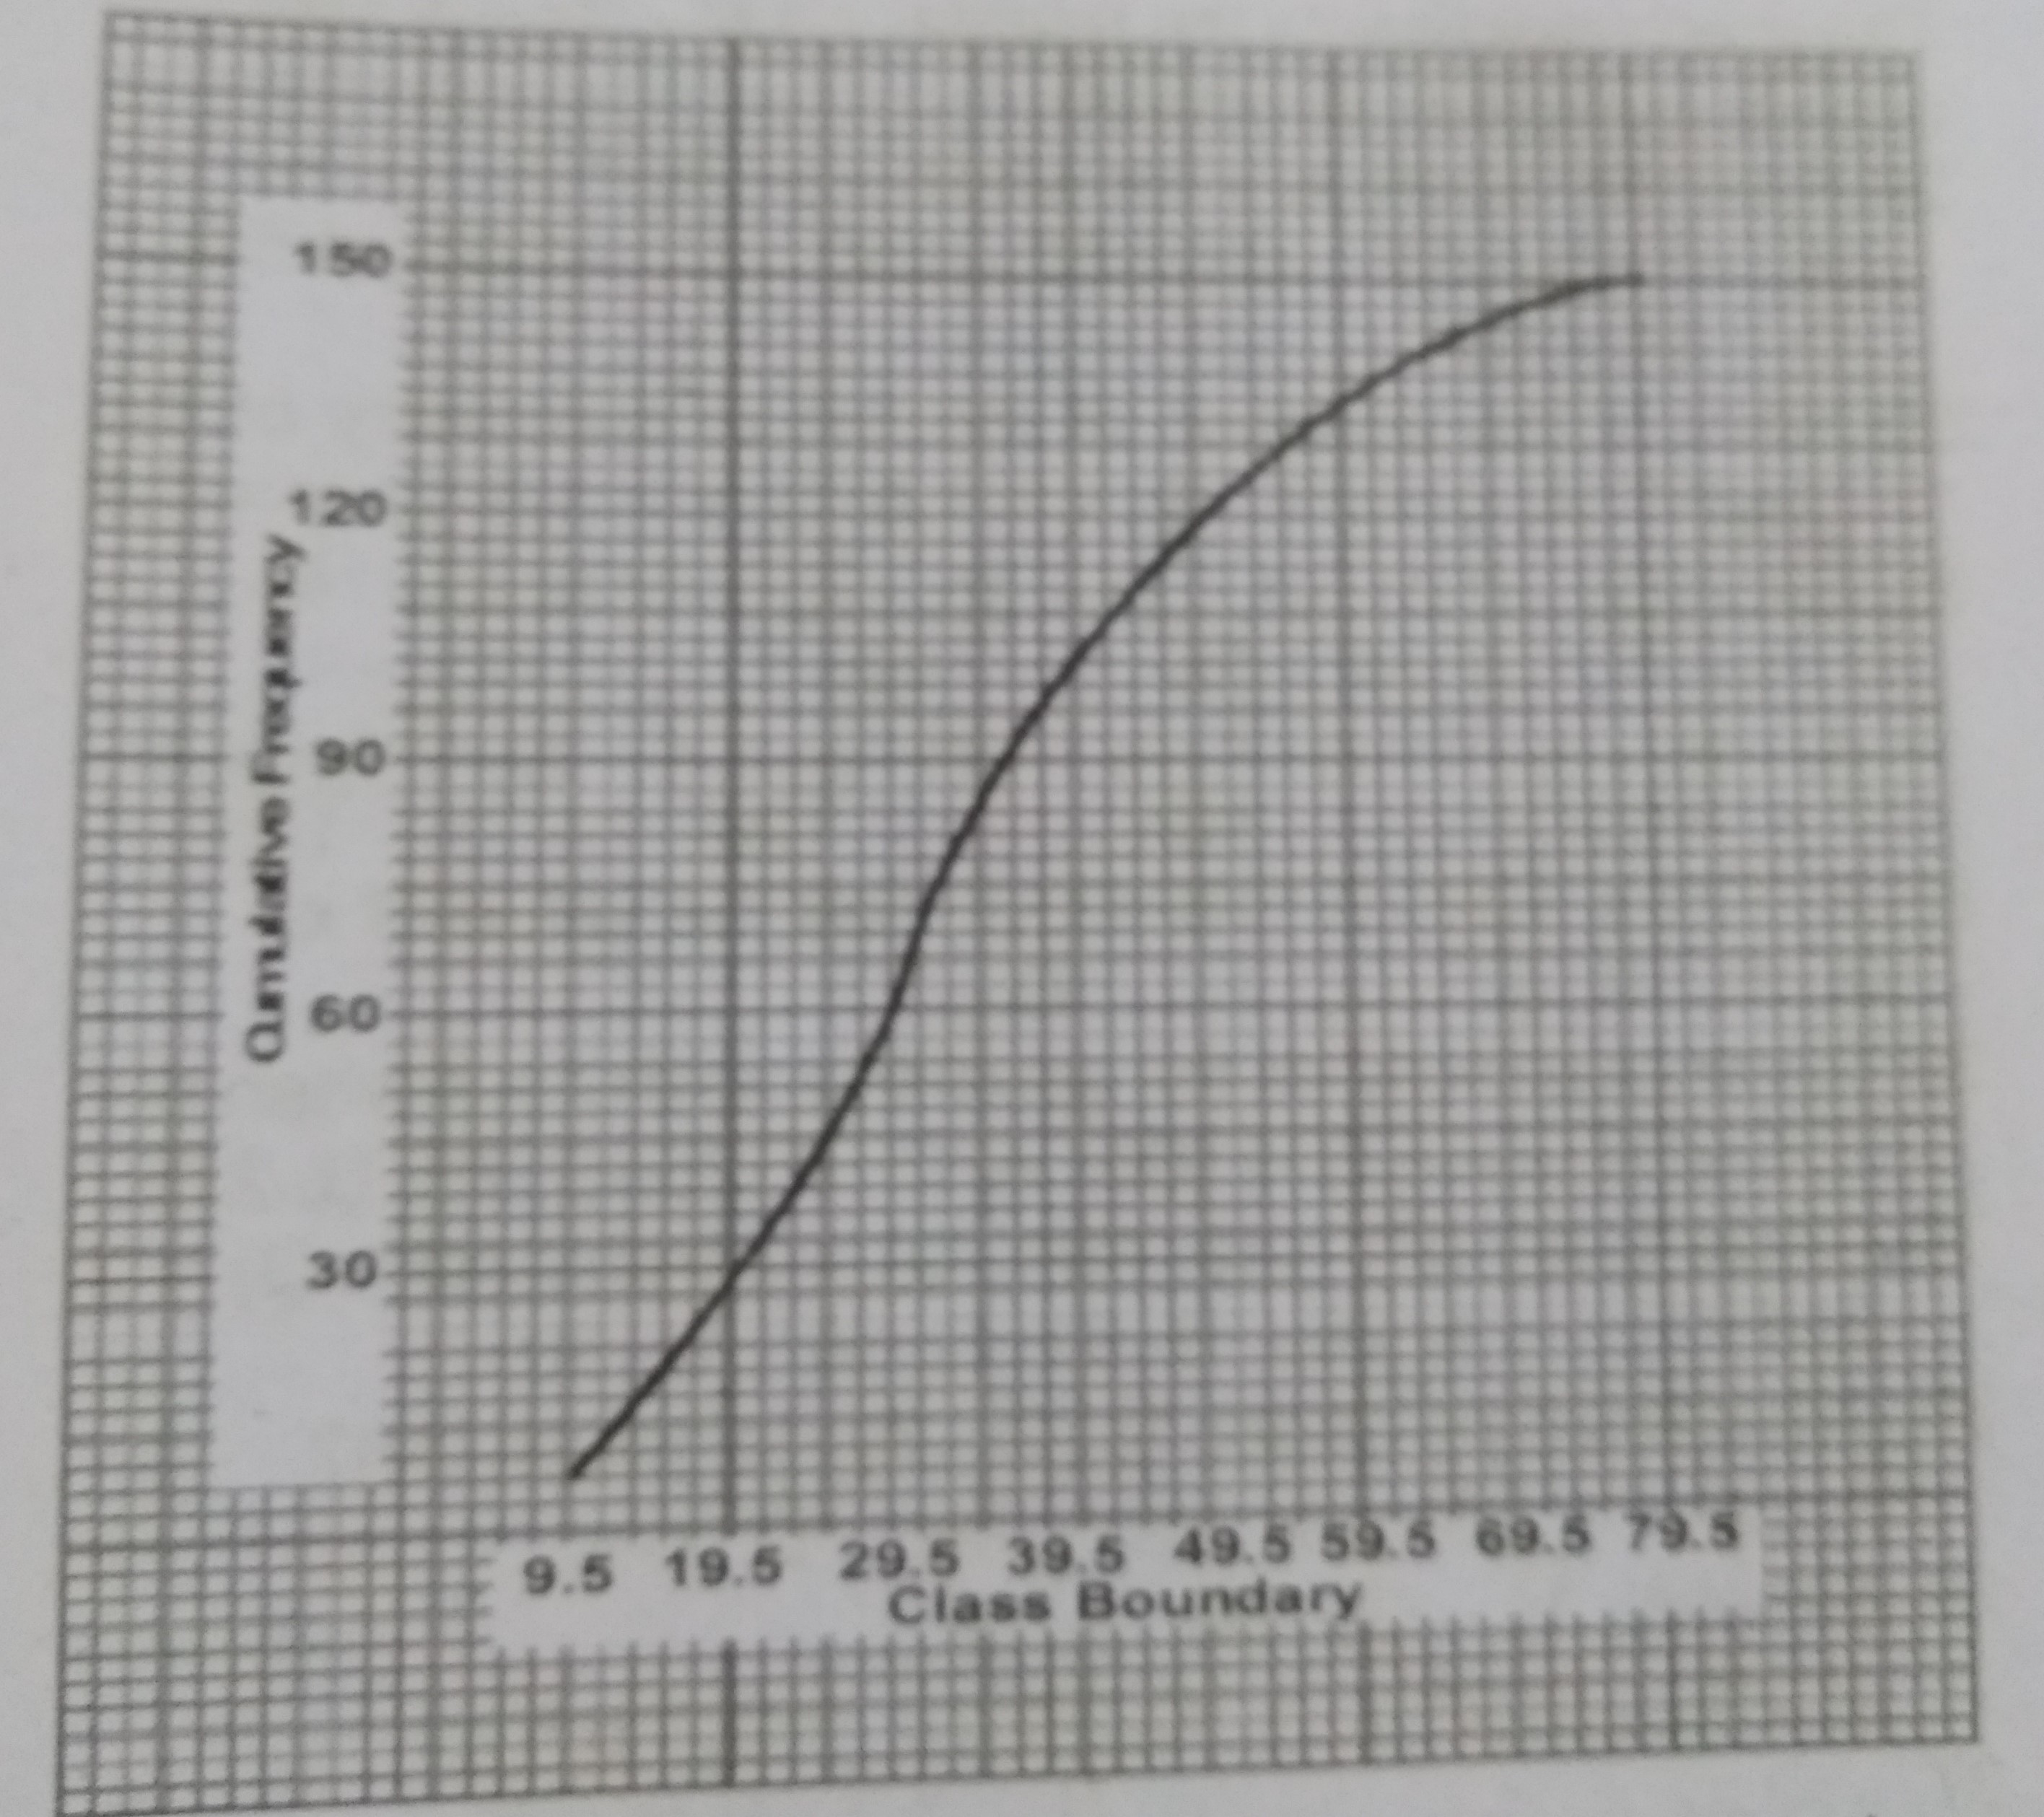
Using the cumulative frequency curve. What is the 80th percentile?
45.5
46.5
47.5
48.5
Correct answer is C
No explanation has been provided for this answer.
Using the cumulative frequency curve, estimate the median of the data represented on the graph.
35.5
36.5
37.5
38.5
Correct answer is B
No explanation has been provided for this answer.
48 cm
40 cm
43 cm
45 cm
Correct answer is C
Perimeter of the sector = \(2r + \frac{\theta}{360°} \times 2\pi r\)
= \(2(10.5) + \frac{120}{360} \times 2 \times \frac{22}{7} \times 10.5\)
= \(21 + 22\)
= 43 cm
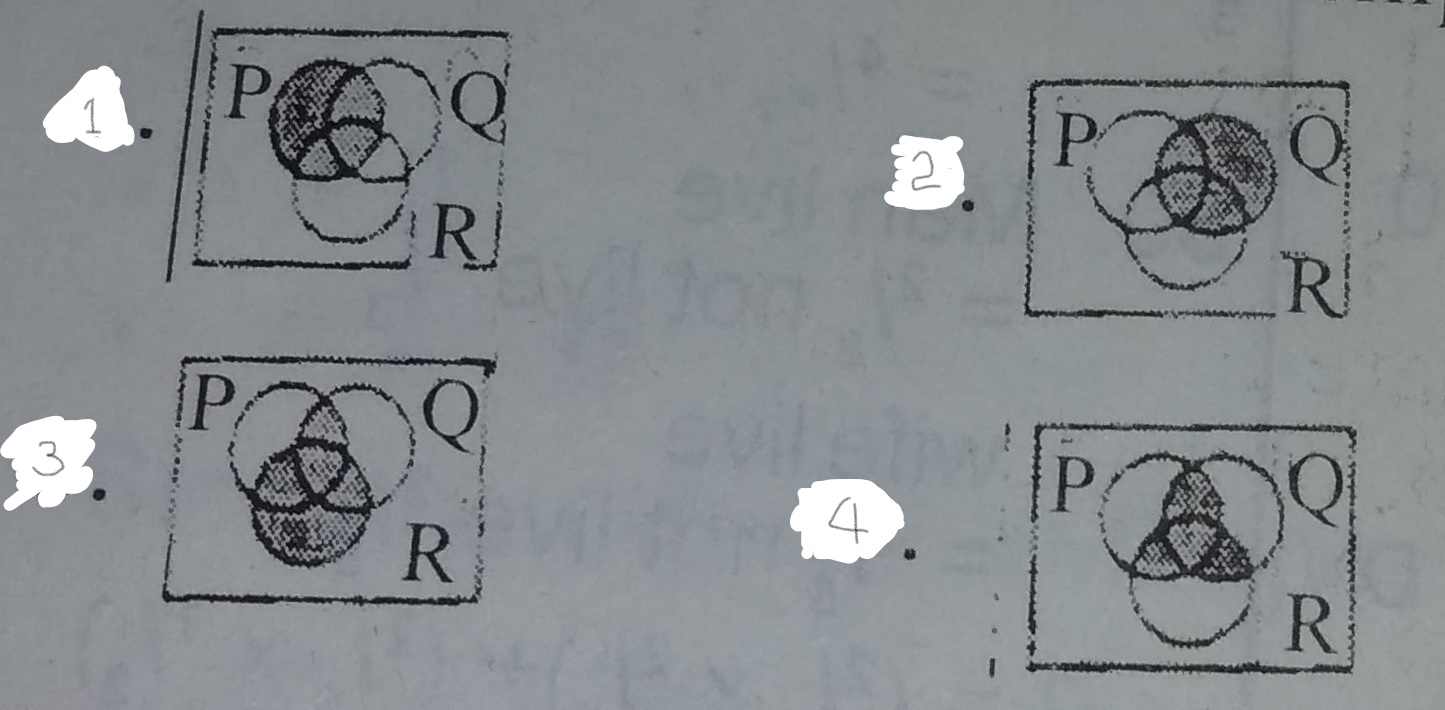
1
2
3
4
Correct answer is C
No explanation has been provided for this answer.
Evaluate \(\int_{0} ^{\frac{\pi}{2}} \sin x \mathrm d x\)
-2
2
1
-1
Correct answer is C
\(\int_{0} ^{\frac{\pi}{2}} \sin x \mathrm d x\)
= \(- \cos x |_{0} ^{\frac{\pi}{2}\)
= \(- \cos (\frac{\pi}{2}) - (- \cos 0)\)
= \(0 + 1\)
= 1