Data Interpretation questions and answers

Data Interpretation Questions and Answers

Data Interpretation questions test one's ability in analysing data, inspecting the elements in data and interpreting them to extract maximum information from the given set of data or information. The data is usually given in the form of charts, tables and graphs.

Practise with our Data Interpretation questions and answers to help you know what to expect, improve your speed and confidence and be really prepared for the actual test.
1.

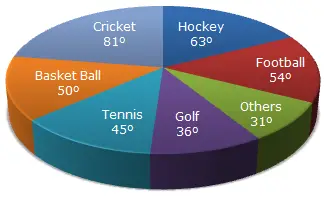
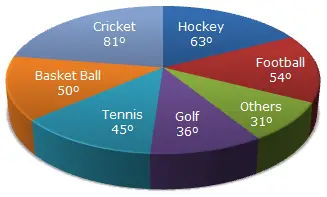
The circle-graph given here shows the spendings of a country on various sports during a particular year. Study the graph carefully and answer the questions given below it.

If the total amount spent on sports during the year was Rs. 2 crores (i.e 20 million), the amount spent on Cricket and Hockey together was:

A.

Rs. 800,000

B.

Rs. 8,000,000

C.

Rs. 12,000,000

D.

Rs. 16,000,000

Correct answer is B

Amount spent on Cricket and Hockey together = Rs. [ (81 + 63)/360 x 2 ] crores

= Rs. 0.8 crores

= Rs. 8,000,000

2.

The circle-graph given here shows the spendings of a country on various sports during a particular year. Study the graph carefully and answer the questions given below it.

How much percent less is spent on Football than that on Cricket?

A.

22 2⁄9%

B.

27%

C.

33 1⁄3%

D.

37 1⁄7%

Correct answer is C

Let the total spendings on sports be Rs. x

Then, Amount spent on Cricket = Rs. ( 81/360 x x ) = Rs. 9x/40

Amount spent on Football = Rs ( 54/360 x x ) = Rs. 3x/20

Difference = Rs. ( 9x/40 - 3x/20 ) = Rs 3x/40

Therefore Required percentage = Rs. [ ((3x/40)/(9x/40)) x 100 ] % = 33 1⁄3 %

3.

The circle-graph given here shows the spendings of a country on various sports during a particular year. Study the graph carefully and answer the questions given below it.

If the total amount spent on sports during the year is Rs. 18,000,000, the amount spent on Basketball exceeds that of Tennis by:

A.

Rs. 250,000

B.

Rs. 360,000

C.

Rs. 375,000

D.

Rs. 410,000

Correct answer is A

Amount spent on Basketball exceeds that on Tennis by:

Rs. ( (50 - 45)/360 x 18,000,000 ) = Rs. 250,000

4.

The circle-graph given here shows the spendings of a country on various sports during a particular year. Study the graph carefully and answer the questions given below it.

How much percent more is spent on Hockey than that on Golf?

A.

27%

B.

35%

C.

37.5%

D.

75%

Correct answer is D

Let the total spendings on sports be Rs. x. Then,

Amount spent on Golf = Rs. ( (36/360) x x ) = Rs. x/10

Amount spent on Hockey = Rs ( (63/360) x x ) = Rs. 7x/40

Difference = Rs. ( 7x/40 - x/10 ) = Rs 3x/40

Therefore Required percentage = Rs. [ (3x/40)/(x/10) x 100 ] % = 75%.

5.

The circle-graph given here shows the spendings of a country on various sports during a particular year. Study the graph carefully and answer the questions given below it.

What percent of total spending is spent on Tennis?

A.

12 1⁄2%

B.

22 1⁄2%

C.

25%

D.

45%

Correct answer is A

Percentage of money spend on Tennis = ( (45/360) x 100 ) % = 12 1⁄2%