The pie chart shows the allocation of money to each secto...

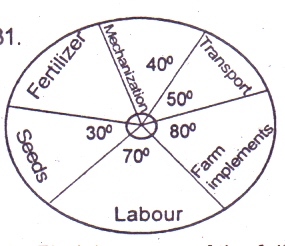
The pie chart shows the allocation of money to each sector in a farm. The total amount allocated to the farm is ₦ 80 000. Find the amount allocated to fertilizer
₦ 35, 000
₦ 40,000
₦ 25,000
₦ 20,000
Correct answer is D

Total angle at a point = 3600
∴ To get the angle occupied by fertilizer we have,
40 + 50 + 80 + 70 + 30 + fertilizer(x) = 360
270 + x = 360
x = 360 - 270
x = 90
Total amount allocated to the farm
= ₦ 80,000
∴Amount allocated to the fertilizer
= fertilizer (angle) × Total amounttotal angle
= 90360 × 80,000
= ₦20,000
Similar Questions
If the lines 2y - kx + 2 = 0 and y + x - k/2 = 0 Intersect at (1, -2), find the value of k...
What value of p will make (x2 - 4x + p) a perfect square?...
Consider the statements: p: Stephen is intelligent q: Stephen is good at Mathematics If p&r...
Find the value of x such that 1x +43x - 56x + 1 = 0...
The graph of cumulative frequency distribution is known as ...