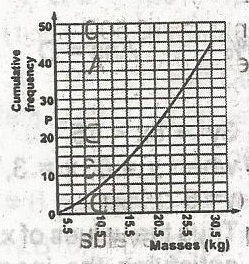
The graph shows the cumulative frequency of the distribut...

The graph shows the cumulative frequency of the distribution of masses of fertilizer for 48 workers in one institution. Which of the following gives the inter-quartile range?
12(Q3−Q1)
Q3 - Q2
Q3 - Q2
Q3 - Q1
Correct answer is D
No explanation has been provided for this answer.
Similar Questions
If y varies inversely as x and x = 3 when y =4. Find the value of x when y = 12 ...
If |53x2| = \(\begin{vmatrix} 3 & 5 \\ 4 & 5 \end{vmatrix}...
Find the number of ways of selecting 8 subjects from 12 subjects for an examination ...
Two dice are tossed. What is the probability that the total score is a prime number. ...
What value of g will make the expression 4x2 - 18xy + g a perfect square? ...
Solve the equation; 3x - 2y = 7, x + 2y = -3 ...
The angles of a pentagon are x°, 2x°, (x + 60)°, (x + 10)°, (x -10)°. ...