The bar chart shows the distribution of marks scored ...

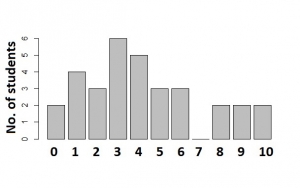
The bar chart shows the distribution of marks scored by a group of students in a test. Use the chart to answer the question below
How many students scored 4 marks and above?
15
11
10
17
Correct answer is D
Students that scored 4 and above = 5 + 3 + 3 + 0 + 2 + 2 + 2
= 17
Similar Questions
A bricklayer charges ₦1,500 per day for himself and ₦500 per day for his assistant. If a two bed...
In the diagram, HK is parallel to QR, PH = 4cm and HQ = 3cm. What is the ratio of KR:PR? ...
Find the sum of the first twenty terms of the progression log a, log a2, log a3........
The area of a square is 144 sqcm. Find the length of the diagonal. ...
This table below gives the scores of a group of students in a Further Mathematics Test. Score...
How many terms of the series 3, -6, +12, - 24, + ..... are needed to make a total of 1-28? ...
The equation of a line is given as 3 x - 5y = 7. Find its gradient (slope)...