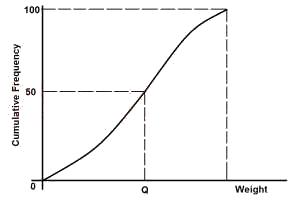
The graph is the cumulative frequency curve for the weigh...

The graph is the cumulative frequency curve for the weight distribution of 100 workers in a factory. Which of the points P,Q,R,S and T indicates the median weight?
A.
T
B.
S
C.
R
D.
Q
E.
P
Correct answer is D
No explanation has been provided for this answer.
Similar Questions
The ages of students in a small primary school were recorded in the table below. Age 5...
Find the distance between two towns P(45°N, 30°W) and Q(15°S, 30°W) if the radius of...
Evaluate 3(x + 2) > 6(x + 3)...
Evaluate 81.81+99.4420.09+36.16 correct to 3 significant figures. ...
A ladder leans against a vertical wall at an angle 60° to the wall, if the foot of the ladder is...