Data Interpretation questions and answers

Data Interpretation Questions and Answers

Data Interpretation questions test one's ability in analysing data, inspecting the elements in data and interpreting them to extract maximum information from the given set of data or information. The data is usually given in the form of charts, tables and graphs.

Practise with our Data Interpretation questions and answers to help you know what to expect, improve your speed and confidence and be really prepared for the actual test.
21.

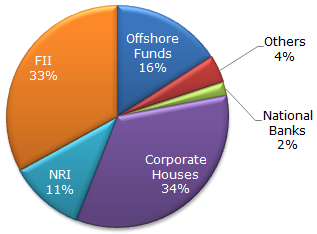
The following pie chart shows the amount of subscriptions generated for India Bonds from different categories of investors.

Subscriptions Generated for India Bonds

In the corporate sector, approximately how many degrees should there be in the central angle ?

A.

120

B.

121

C.

122

D.

123

Correct answer is C

34 x 3.6 = 122.4 (since 1% = 3.6 degrees)

22.

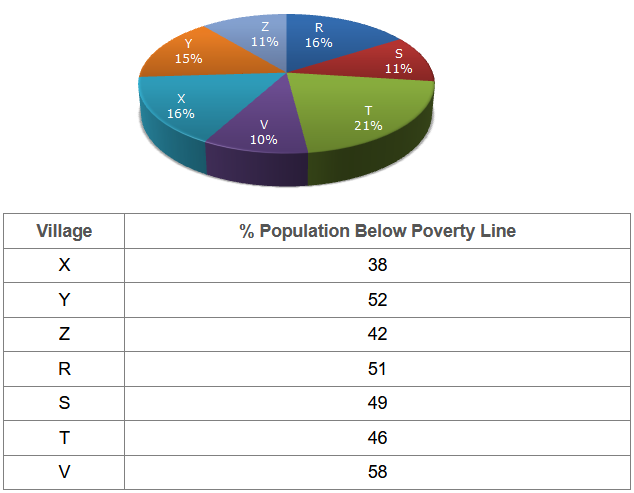
Study the following pie-chart and the table and answer the questions based on them.

Proportion of Population of Seven Villages in 1997

If in 1998, the population of villages Y and V increase by 10% each and the percentage of population below poverty line remains unchanged for all the villages, then find the population of village V below poverty line in 1998, given that the population of village Y in 1997 was 30000.

A.

11250

B.

12760

C.

13140

D.

13780

Correct answer is B

Population of village Y in 1997 = 30000 (given).

Let the population of village V in 1997 be v.

Then, 15 : 10 = 30000 : v   =>   v = (30000 x 10)/15 = 20000

Now, population of village V in 1998 = 20000 + (10% of 20000) = 22000.

Therefore Population of village V below poverty line in 1998 = 58% of 22000 = 12760.

23.

Study the following pie-chart and the table and answer the questions based on them.

Proportion of Population of Seven Villages in 1997

Find the population of village S if the population of village X below poverty line in 1997 is 12160.

A.

18500

B.

20500

C.

22000

D.

26000

Correct answer is C

Let the population of village X be x.

Then, 38% of x = 12160   =>   x = (12160 x 100)/38 = 32000

Now, if s be the population of village S, then

16 : 11 = 32000 : s => s = ( (11 x 3200)/16 ) = 22000

24.

Study the following pie-chart and the table and answer the questions based on them.

Proportion of Population of Seven Villages in 1997

The ratio of population of village T below poverty line to that of village Z below poverty line in 1997 is:

A.

11 : 23

B.

13 : 11

C.

23 : 11

D.

11 : 13

Correct answer is C

Let N be the total population of all the seven villages.

Then, population of village T below poverty line = 46% of (21% of N)

and Population of villages Z below the poverty line = 42% of (11% of N)

Therefore Required ratio = (46% of (21% of N))/(42% of (11 % of N)) = (46 x 21)/(42 x 11) = 23/11.

25.

Study the following pie-chart and the table and answer the questions based on them.

Proportion of Population of Seven Villages in 1997

If the population of village R in 1997 is 32000, then what will be the population of village Y below poverty line in that year?

A.

14100

B.

15600

C.

16500

D.

17000

Correct answer is B

Population of village R = 32000 (given).

Let the population of village Y be y.

Then, 16 : 15 = 32000 : y   =>   y = ( (15 x 32000)/16 ) = 30000

Therefore Population of village Y below poverty line = 52% of 30000 = 15600.