Data Interpretation questions and answers

Data Interpretation Questions and Answers

Data Interpretation questions test one's ability in analysing data, inspecting the elements in data and interpreting them to extract maximum information from the given set of data or information. The data is usually given in the form of charts, tables and graphs.

Practise with our Data Interpretation questions and answers to help you know what to expect, improve your speed and confidence and be really prepared for the actual test.

6.

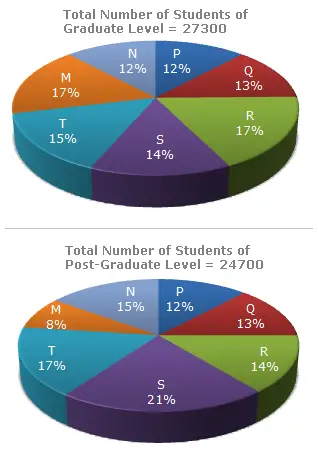
The following pie-charts show the distribution of students of graduate and post-graduate levels in seven different institutes in a town.

Distribution of students at graduate and post-graduate levels in seven institutes:

Total number of students studying at post-graduate level from institutes N and P is

A.

5601

B.

5944

C.

6669

D.

8372

Correct answer is C

Required number = (15% of 24700) + (12% of 24700)

= 3705 + 2964

= 6669

7.

The following pie-charts show the distribution of students of graduate and post-graduate levels in seven different institutes in a town.

Distribution of students at graduate and post-graduate levels in seven institutes:

What is the ratio between the number of students studying at post-graduate level from institutes S and the number of students studying at graduate level from institute Q?

A.

13 : 19

B.

21 : 13

C.

13 : 8

D.

19 : 13

Correct answer is D

Required ratio = (21% of 24700)/(13% of 27300) = (21 x 24700)/(13 x 27300) = 19/13

8.

The following pie-charts show the distribution of students of graduate and post-graduate levels in seven different institutes in a town.

Distribution of students at graduate and post-graduate levels in seven institutes:

How many students of institutes of M and S are studying at graduate level?

A.

7516

B.

8463

C.

9127

D.

9404

Correct answer is B

Students of institute M at graduate level= 17% of 27300 = 4641.

Students of institute S at graduate level = 14% of 27300 = 3822.

Therefore Total number of students at graduate in institutes M and S  = (4641 + 3822) 

= 8463

9.

The following pie-charts show the distribution of students of graduate and post-graduate levels in seven different institutes in a town.

Distribution of students at graduate and post-graduate levels in seven institutes:

What is the ratio between the number of students studying at post-graduate and graduate levels respectively from institute S?

A.

14 : 19

B.

19 : 21

C.

17 : 21

D.

19 : 14

Correct answer is D

Required ratio = (21% of 24700)/(14% of 27300) = (21 x 24700)/14 x 27300 = 19/14

10.

The following pie-charts show the distribution of students of graduate and post-graduate levels in seven different institutes in a town.

Distribution of students at graduate and post-graduate levels in seven institutes:

What is the total number of graduate and post-graduate level students in institute R?

A.

8320

B.

7916

C.

9116

D.

8099

Correct answer is D

Required number = (17% of 27300) + (14% of 24700)

= 4641 + 3458

= 8099.