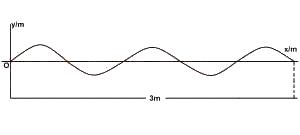
The diagram above shows a waveform in which energy is tra...

The diagram above shows a waveform in which energy is transferred from A to B in a time of 2.5 x 10⁻³s. Calculate the frequency of the wave
2.0 x 10³Hz
1.0 x 10³Hz
4.0 x 10⁻²Hz
1.0 x 10⁻³Hz
5.0 x 10⁴Hz.
Correct answer is B
The waveform moved from A to B in \(2.5 \times 10^{-3}\) seconds.
From the diagram, A to B has \(2\frac{1}{2}\) complete oscillations between it, Therefore, the period of the oscillation is
\(\frac{2.5 \times 10^{-3}}{2.5} = 1 \times 10^{-3} s\)
\(Frequency = \frac{1}{Period}\)
= \(\frac{1}{1 \times 10^{-3}} = 1 \times 10^{3} Hz\)
Similar Questions
The inner diameter of a small test tube can be measured accurately using a ...
In the figure, the value of R is ...
If the relative density of gold is 19.2, the volume of 2.4kg of gold is? ...
The core of an efficient transformer should consist of laminated pieces of metal in order to ...
On a stationary sail boat, air is blown from a fan attached to the boat. The boat ...