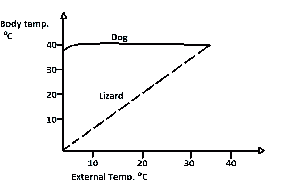
The graph above shows the relationship between the body a...

The graph above shows the relationship between the body and atmospheric temperature for dog and lizard.
What is the most appropriate deduction that could be made from the graph?
Lizards are more likely to survive hazards than dogs
Both animals maintain a constant body temperature
The dog's body temperature is independent of the external temperature
The lizard's body temperature varies with that of the dog
Correct answer is C
No explanation has been provided for this answer.
Similar Questions
Animal cells are different from plant cells because animal cells have ...
The mammalian lung is made air tight by the ...
Gaseous exchange in annelids is more advanced and efficient compared to flatworms because? ...
Which of the following has the most primitive respiratory system? ...
Which of the following is a living organism? ...
Plants suitable for experiments in genetics must not ...
Which of these is NOT a method of improving crop yield? ...
The capture and digestion of insects by a pitcher plant is a special form of nutrition termed ...
Examples of organisms that carry out extracellular digestion are? ...