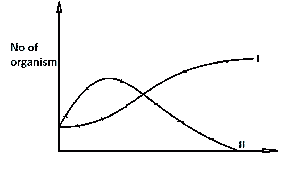
The above diagram represents a competitive interaction be...

The above diagram represents a competitive interaction between organism in communities I and II. Which of the following statements is CORRECT?
The population of I was higher than II at the beginning of the experiments
II was wiped out from the enviroment at the end of the experiments
The population of II was always lower than that of I
The population of I was lower at the end of the experiment than at the beginning
Correct answer is B
No explanation has been provided for this answer.
Similar Questions
Which of the following instruments is not used in measuring abiotic factors in a habitat? ...
The part labeled II is the ...
Which of the structure listed below is peculiar to the axis vertebra? ...
The stomata of leaves are similar in function to the ...
Toads and lizards in an ecosystem depend on a limited quantity of food. This is an example of ...
In the diagram, the type of adaptation shown in the larva is ...
In the mammalian respiratory system. exchange of gases occurs in the ...
If a DNA strand has a base sequence TCA, its complementary strand must be ...