The image below shows the volume and direction of passeng...

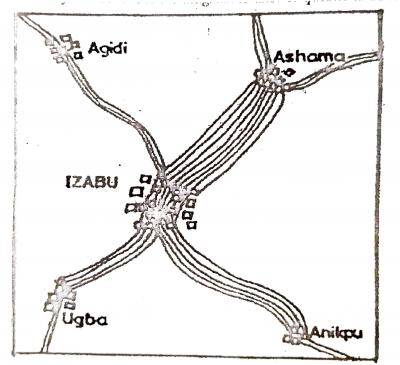
The image below shows the volume and direction of passenger traffic between IZABU town and its surrounding towns in the year 2001.
Scale: 1 line represents 1,500 persons
Which of the following statistical methods is represented above?A.
Dot map
B.
Isohaline map
C.
Flow chart
D.
Bar chart
Correct answer is C
No explanation has been provided for this answer.
Similar Questions
Which of these African countries is noted for lumbering? ...
The term gauge in railway transport refers to the? ...
What method of mining is used for extracting petroleum in Africa? ...
The area marked T is rich in ...
Which of the following environmental hazards has been paired with the wrong factor? ...