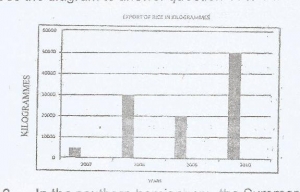
The diagram above represents the export of rice i...

The diagram above represents the export of rice in Kilogrammes from Country X between 2007 and 2010.
In which year did Country X have the highest production of rice?
2007
2008
2009
2010
Correct answer is D
No explanation has been provided for this answer.
Similar Questions
Which of the following is an effect of rural-urban migration on the source region? ...
Only one of these statements about West Africa is true. Which is it? ...
Low population densities of the middle belt of West African countries can best be described as ...
Which of the following is not typical submarine relief feature? ...
Which of the following areas in the world has the highest population density? ...
Name the feature crossed by the footpath between points Y and Z ...
Which of the following coastal features is not due to erosion'? ...