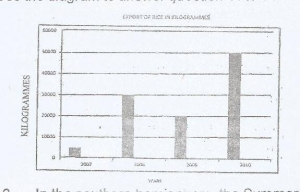
The diagram above represents the export of rice i...

The diagram above represents the export of rice in Kilogrammes from Country X between 2007 and 2010.
How much rice was produced in 2010 by Country X?
10,000 Kilogrammes
20,000 Kilogrammes
50,000 Kilogrammes
60,000 Kilogrammes
Correct answer is C
No explanation has been provided for this answer.
Similar Questions
The upfolded portion of a fold mountain is called_____? ...
Lines joining places of equal sunshine duration on maps are known as ...
What percentage of the world export commodities in figure 1 is represented by crude oil? ...
Which of the following least influences population density in Nigeria? ...
Convectional rains are typical ...
What is the sum total of human resources available in a country called? ...
The dominant foreign exchange earner of Senegal is ...
Which of the following is not a process of chemical weathering? ...