The diagram above represents the export of rice i...

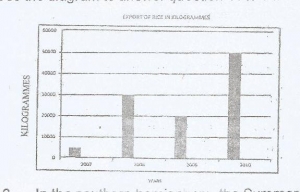
The diagram above represents the export of rice in Kilogrammes from Country X between 2007 and 2010.
What is the name of the diagram above?
Line graph
Bar graph
Pie Chart
Star graph
Correct answer is B
No explanation has been provided for this answer.
Similar Questions
The earth is enveloped by a mixture of gases referred to as the ...
Which of the following rocks is organically formed? ...
A plateau that is enclosed by two fold mountains is called ...
Textile Industry - 7.2o Petroleum Industry - 172.8o Iron and Steel Indus...
Which of the following factors least effects population concentration in the North-east of USA? ...
The equatorial diameter of the earth is approximately ...
Which of the following coastal features is not due to erosion'? ...
In its old stage, a river would I. be interrupted by waterfalls and rapids II. flow...
How is the mean annual rainfall of a given place calculated using records for 35 years? ...