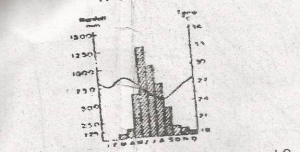
The annual range of temperature as shown in the graph is ...

The annual range of temperature as shown in the graph is approximately
4oC
8oC
24oC
28oC
Correct answer is A
No explanation has been provided for this answer.
Similar Questions
The factor controlling the onset and cessation of the rainy season in Nigeria is the? ...
Which of the following best describes high population growth? ...
Rainfall caused by the movement of air over a mountain is termed ...
Plant growth normally ceases, when the temperature falls below? ...
The predominant type of agriculture in the eastern part the source of the raw material is? ...
The landform is the result ...
Under the Greek system of climate classification, the world is divided into ...
The fadama lands of the Niger/Benue trough are mostly known for the commercial production of? ...