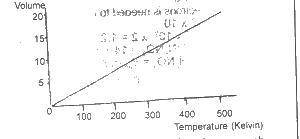
Which of the gas laws does this graph illustrate?
...
Which of the gas laws does this graph illustrate?
Boyle
Charles
Gay-Lussac
Graham
Correct answer is B
Charles' law describes the effect of temperature changes on the volume of a given mass of gas at a constant pressure.
Similar Questions
A substance L reacts with NH4NO3(aq) to generate ammonia gas. L is likely to be...
The compound above contains ...
How many atoms are present in 6.0g of magnesium? [Mg = 24, NA = 6.02 x 10²³ mol-1]...
3Cl2 + 2NH3 → N2 + 6HCl. In the above reaction, ammonia acts as...
On exposure to hydrogen sulphide, moist lead (II) ethanoate paper turns ...
Which of the following gases will bleach moist litmus paper? ...
Which method is NOT used to determine rate of a reaction? ...
Which of the elements in the table below would react more readily with chlorine? &nbs...