The following diagram illustrates the rate curve that was...

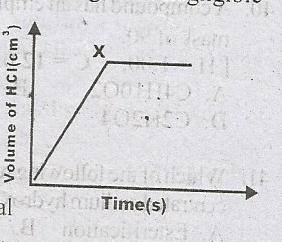
The following diagram illustrates the rate curve that was obtained when Mg reacted with excess dilute HCl.
The diagram became horizontal at X because
The reaction was slowed down
All the dilute HCl has reacted
All the Mg has reacted
Hydrogen gas is produced at a steady rate
Correct answer is C
No explanation has been provided for this answer.
Similar Questions
Which of the following ions requires the largest quantity of electricity for dischar...
Which of the following substances is a peroxide? ...
The mass number of a nucleus is ...
What is the atomic number of Yttrium? ...
Which important nitrogen-containing compound is produced in Haber's process? ...
What is the atomic number of Krypton? ...
H- + H2(I)O → H2(g) + OH-(aq). From the equation above, it can be inferred that the?...