The above graph shows a typical heating curve from the solid...

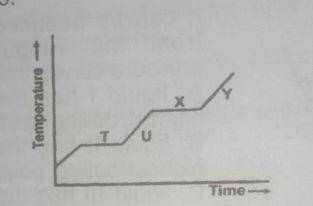
The above graph shows a typical heating curve from the solid phase through the liquid phase to the gaseous phase of a substance. Which part of the curve shows solid and liquid in equilibrium?
A.
T
B.
U
C.
X
D.
Y
Correct answer is A
point T shows solid-liquid equilibrium. At this point, the substance been heated has begun to melt but has not completely melted forming a solid liquid mixture.
Similar Questions
Why does the treatment of cotton fabrics with dilute acids weaken the materials? ...
Consider the following reaction equation: CuO(s) + H2(g) → Cu(s) + H2O(1) Which substance ...
What is the main environmental concern associated with sulfur dioxide emissions? ...
Pure solvents are obtained by ...
A supersaturated solution is said to contain ...
The principal constituent of natural gas is ...
Which of the following statement is true of the electrochemical series? ...
Which of the following can be obtained by fractional distillation? ...