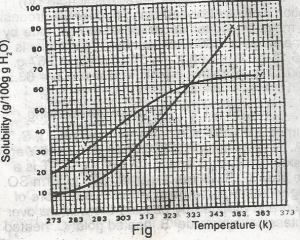
The diagram shown above represents the solubility curves of two salts, X and Y, in water, use this diagram to answer the question. If 80 g each of X and Y are taken up in 100 g of water at 353 K we shall have
only 10g of X undissolved
only 16 g of Y undissolved
10 g of X and 16 g of Y undissolved
all X and Y dissolved
all X and Y undissolved
Correct answer is B
For salt X, from the graph, 80g of X dissolves by 349K, so by 353K, all 80g of X is dissolved totally in 100g of water. For salt Y, from the graph, 64g of Y dissolves by 353K, so (80-64)g of Y is left undissolved. This is 16g of Y left undissolved at that temperature.
Similar Questions
The scum formed when soap is mixed with hard water could be ...
Which of the following statements about dative bonding is not correct? ...
The carbon atoms on ethane are ...
Which of the compounds will leave a metal residue when heated? ...
The following compounds are condensation polymers except ...
3CuO(s) + 2NH3(g) → 3Cu(s) + 3H2O(I) N2(g) (i). 2NH3(g) + 3Cl2(g) → 6HCl(g) + N2(g) (ii). ...
MnO-4 + 8H+ + ne → Mn++ + 4H2O. Which is the value of n in the reaction above?...