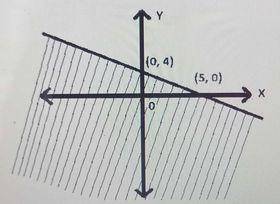
Which inequality describes the graph above?
...
Which inequality describes the graph above?
4y+5x≥20
5y+4x≤20
4y+5x≤20
5y+4x≥20
Correct answer is B
First, we find the equation of the boundary line using the two intercepts.The slope is
m = 4−00−5=45
The y-intercept is 4
The slope-intercept form of the equation is therefore
y = -45x+4
⟹y+45x=4
Multiply both sides by 54
⟹54(y+45x)=4×54
⟹54y+x=5
Multiply both sides by 4
⇒ 5y+4x=20
The inequality is therefore either 5y+4x≤20 or 5y+4x≥20.
Using the test point (0, 0) -The origin
⇒ 5(0) + 4(0) ≤ 20
⇒ 0 ≤ 20 (True)
∴ The inequality is 5y+4x≤20
Similar Questions
Find the absolute mean deviation of the sample 10, 12, 14, 11, 13. ...
The values of x when y = 3 are approximately...
In a figure, PQR = 60o, PRS = 90o, RPS = 45o, QR = 8cm. Determine PS...
Evaluate log106 + log1045 - log1027 without using logarithm tables...
In the diagram below, O is the center of the circle if ∠QOR = 290o, find the size ∠QPR ...