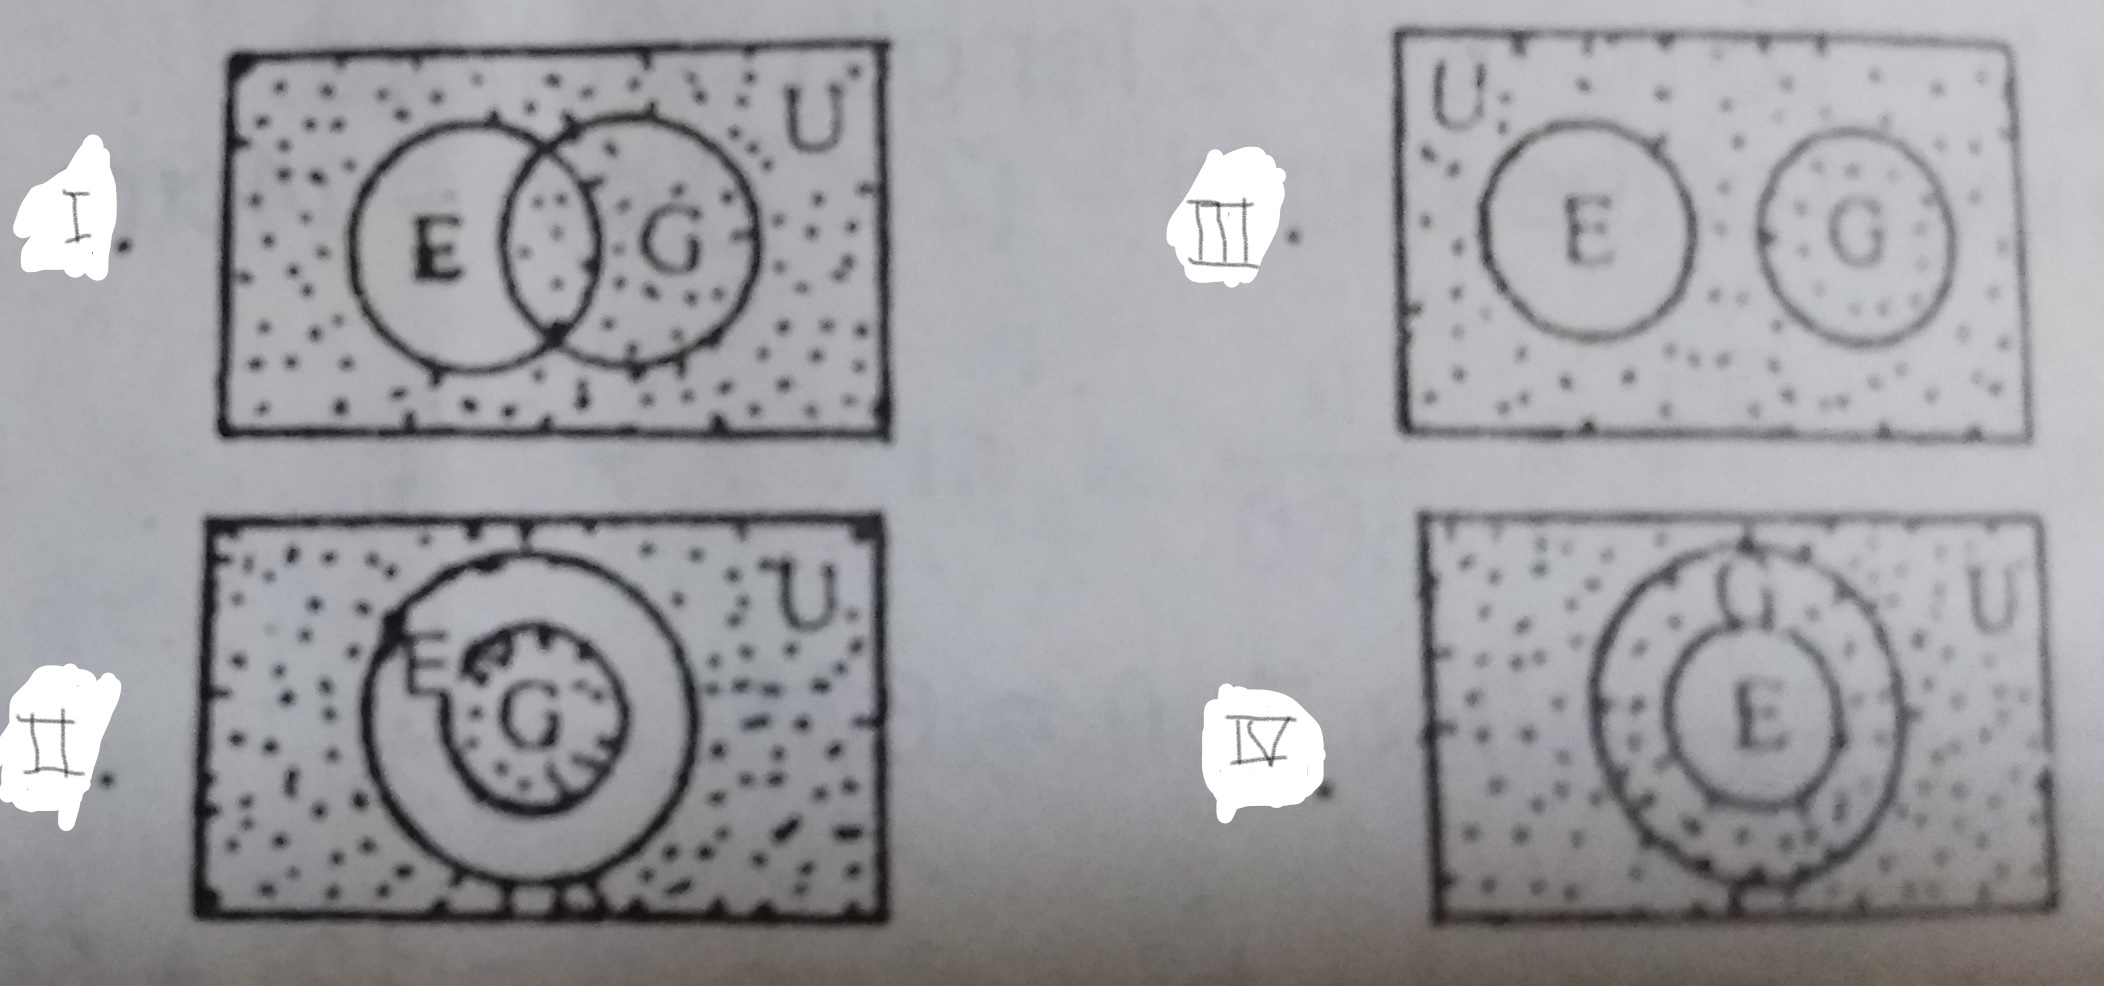
Consider the statements:
P = All students ...

Consider the statements:
P = All students offering Literature(L) also offer History(H);
Q = Students offering History(H) do not offer Geography(G).
Which of the Venn diagram correctly illustrate the two statements?
A.
A
B.
B
C.
C
D.
D
Correct answer is C
No explanation has been provided for this answer.
Similar Questions
One of the factors of (mn - nq - n2 + mq) is (m - n). The other factor is? ...
Write the name of a triangle with the vertices (1, -3), (6, 2) and (0,4)? ...
What is the value of x when y = 5? y = \(\frac{1}{2}\) x + 1...
If p-2g + 1 = g + 3p and p - 2 = 0, find g ...
U is inversely proportional to the cube of V and U = 81 when V = 2. Find U when V = 3 ...