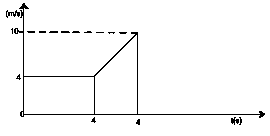
The diagram illustrates the velocity-time graph of a body...

The diagram illustrates the velocity-time graph of a body. Calculate the distance covered by the body during the motion
15m
84m
72m
48m
Correct answer is C
Distance covered = Area under the graph
D = area of square + area of trapezium
D = L x L + 1/2(a+b)h
D = 4 x 4 + 1/2( 4+ 10)8
D = 16 + 1/2 x 14 x 8
D = 16 + 56
D = 72m.
Similar Questions
Ether produces a cooling effect when it is poured on the hand because it has ...
What is the least possible error encountered when taking measurement with a meter rule? ...
An instrument used to measure relative humidity is the? ...
Which of the following statements about a moving object is correct? ...
A cell of e.m.f 12V and internal resistance 4Ω is connected to an external resistor of resista...