Two identical cups containing the same volume of water at...

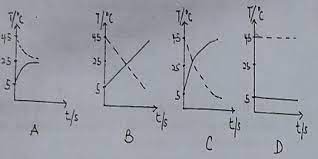
Two identical cups containing the same volume of water at 45°C and 5°C, are left in a room at 25°C. Which of the following graphs correctly illustrates the variation of temperature with time?
A.
A
B.
B
C.
C
D.
D
Correct answer is C
No explanation has been provided for this answer.
Similar Questions
Which of the following statements is not a characteristic of a plane progressive wave? ...
A lead bullet of mass 0.05kg is fired with a velocity of 200ms−1 into a block of mass 0.95kg....
Determine the potential difference. V across the parallel resistors ...