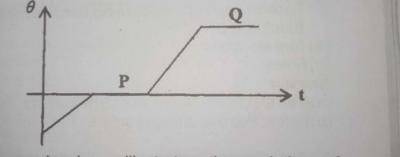
The graph above illustrates the variation of temperature ...

The graph above illustrates the variation of temperature θ with time (t) for a solid that is being heated. Which processes take place at segments P and Q respectively?
Freezing and vaporization
Evaporation and solidification
Melting and boiling
Condensation and evaporation
Correct answer is C
Since the substance is solid, it will need heat to melt to liquid and once the liquid starts boiling temperature will remain the same.
Similar Questions
In a series R-L-C circuit at resonance, impedance is---- ...
I. Small size. II. Low power requirement III. Not easily damaged by high temperature IV. Highly d...
Light from the Sun reaches us in nearly ...
A cell can supply currents of 0.60 A and 0.30 A through a 2.0 ω and a 5.0 ω resistor res...
The momentum of a car moving at a constant speed in a circular track ...