The diagram above represents the stress-strain graph of a...

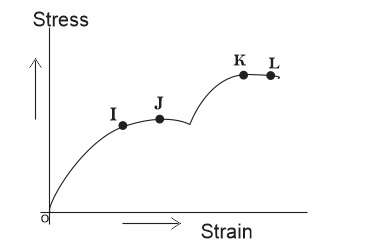
The diagram above represents the stress-strain graph of a loaded wire. Which of these statements is correct?
At J, the wire becomes plastic
J is the yield point
L is the elastic limit
At K, the wire breaks
Correct answer is B
- I is the elastic limit
- the end of the constant part J is the yield point
- L is the break point.
Similar Questions
Pure silicon can be converted to a p-type by adding a controlled amount of ...
At what frequency would a capacitor of 2.5μF used in radio circuit have a resistance of 250Ω...
The friction which exist between two layers of liquid in relative motion is called ...
Two sound waves have frequencies of 12Hz and 10Hz. Calculate their beats period ...
The relative density of dilute tetraoxosulphate (vi) acid in a battery is measured with a ...
The energy stored in a capacitor of capacitance 10μF carrying a charge of 100μC...
In which of the following are crystalline structures observable? I. Gas II. Liquid III. Soli...