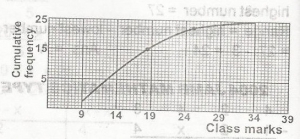
The graph above shows the cumulative frequency curve of t...

The graph above shows the cumulative frequency curve of the distribution of marks in a class test. What percentage of the students scored more than 20 marks?
68%
28%
17%
8%
Correct answer is B
class-marks(x)(freq. (f)cum. freq.93.....3146....3+6=9199.....9+9=18243.....18+3=21292.....21+2=23342.....23+2=2525
% of students scoring more than 20 marks
= 725 x 100% = 28%
Similar Questions
Find the volume of a cone which has a base radius of 5 cm and slant height of 13 cm. ...
A ladder leans against a vertical wall at an angle 60° to the wall, if the foot of the ladder is...
If sin x = 513 and 0o ≤ x ≤ 90o, find the value of (cos x - tan x)...
A coin is thrown 3 times. What is the probability that at least one head is obtained? ...
If 2x + y = 10, and y ≠ 0, which of the following is not a possible value of x?...
A variable y is inversely proportional to x2, when y = 10, x = 2. What is y when x = 10?...
In the diagram, QRT is a straight line. If angle PTR = 90°, angle PRT = 60°, angle PQR = 30&...