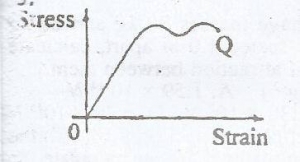
The diagram given, represents the graph of stress against...

The diagram given, represents the graph of stress against strain for an elastic wire. The point Q on the graph is the
A.
elastic limit
B.
breaking point
C.
yield point
D.
proportional limit
Correct answer is B
No explanation has been provided for this answer.
Similar Questions
Which of the following statements about the human eye and the camera is correct? ...
The fundamental frequency of vibration of a sonometer wire may be halved by ...
The inner diameter of a test tube can be measured accurately using a? ...
A body of mass m moving around a circle of radius r with a uniform speed v&...