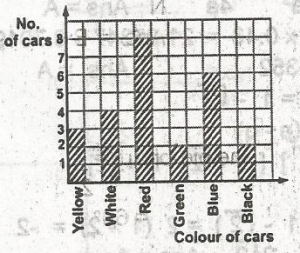
The bar chart shows different colours of cars passing a p...

The bar chart shows different colours of cars passing a particular point of a certain street in two minutes. What fraction of the cars is yellow
15
225
415
325
Correct answer is D
colour of carsNumber (frequency)yellow3white4red8green2blue6black225
Thus, the fraction of the total numbers that are yellow is 325
Similar Questions
The median of the set of numbers 4, 9, 4, 13, 7, 14, 10, 17 is...
Calculate the volume of the regular three dimensional figure drawn above, where < ABC = 90° (...
Solve the equation x2 - 2x - 3 = 0...
Simplify (0.09)2 and give your answer correct to 4 significant figures...
Approximate 0.0033780 to 3 significant figures ...
A box contains 12 identical balls of which 5 are red, 4 blue, and the rest are green. If ...