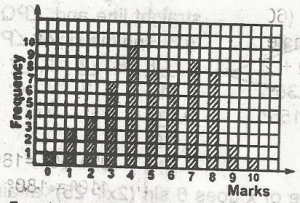
The bar chart shows the distribution of marks scored by 6...

The bar chart shows the distribution of marks scored by 60 pupils in a test in which the maximum score was 10. If the pass mark was 5, what percentage of the pupils failed the test?
59.4%
50.0%
41.7%
25.0%
Correct answer is C
\(\begin{array}{c|c} x & 0 & 1 & 2 & 3 & 4 & 5 & 6 & 7 & 8 & 9 & 10 \\ \hline f & 1 & 9 & 4 & 7 & 10 & 8 & 7 & 9 & 8 & 2 & 1\end{array}\)
no pupils who failed the test = 1 + 3 + 4 + 7 + 10
= 25
5 of pupils who fail = \(\frac{25}{60}\) x 100%
= 41.70%
Similar Questions
Simplify and express in standard form \(\frac{0.00275 \times 0.0064}{0.025 \times 0.08}\)...
A chord of a circle of a diameter 42cm subtends an angle of 60° at the centre of the circle. Fin...
Find the truth set of the equation x2 = 3(2x + 9)...
The expression 4x2 - 4 has the following as its factors EXCEPT...