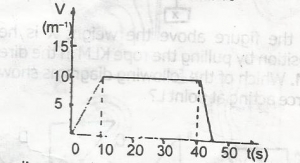
The diagram above shows a velocity time graph representin...

The diagram above shows a velocity time graph representing the motion of a car. Find the total distance covered during the acceleration and retardation of the motion
75m
150m
300m
375m
Correct answer is D
Total Distance covered is the Area of the Trapezium
Area of the Trapezium = 12 X ( sum of parallel sides ) X height
= 12 X ( 30 + 45 ) X 10
: S = 375m
Similar Questions
When vibration occurs in air column, the distance between a node and an antinode is equal to ...
The relationship between the coefficient of linear expansion α and volumetric expansion (\(...
Of the following, which is different from the others? ...
A bulb marked 240V, 40W is used for 30 minutes. Calculate the heat generated ...
The following are some units I. Ns II. Non III. Nm−2 IV. J°K−1 V. JKg\(^{-1}\...