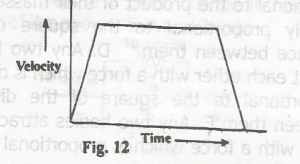
fig 12 shows the velocity time graph of a car which starts f...

fig 12 shows the velocity time graph of a car which starts from rest and is accelerated uniformly at the rate of 3m sec-2 for 5 seconds. It attains a velocity which is maintained for a minute, The car is then brought to rest by a uniform retardation after another 3 seconds. calculate the total distance covered
A.
900m
B.
1920m
C.
960m
D.
860m
Correct answer is C
No explanation has been provided for this answer.
Similar Questions
Which of the following characteristics of light determines its colour? ...
A wire of cross-sectional area 0.60mm2 has a restivity of 7.2 x 10⁻⁷ Ω. Calculate the lengt...
Which of the following readings cannot be determined with a meter rule? ...
The force with which an object is attracted to the earth is called its ...
A wire of cross-sectional area 2π * 10−8 m2 and resistivity 1.1 x 10\(...