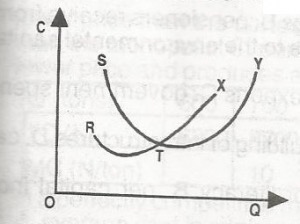
In the diagram above, RTX and STY are the marginal cost a...

In the diagram above, RTX and STY are the marginal cost and the average cost curves responsively of a perfectly competitive firm. The supply curve of the firm is indicated by
TX
RT
ST
TY
Correct answer is A
No explanation has been provided for this answer.
Similar Questions
A firm faces diminishing returns when its ...
When elasticity is zero, the demand curve is ...
The Malthusian theory of population does not concern itself with ...
For a firm to break even in the long run, the marginal cost curve must cut the ...
The basic principles of cooperative societies are those of ...
One of the positive contributions of the petroleum industry to Nigeria’s economic development ...
A rightward shift in the production possibility frontier may be due to ...