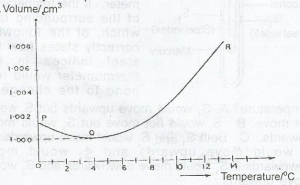
The graph above shows the expansion of water as the tempe...

The graph above shows the expansion of water as the temperature increases from 0°C. Which of the following deductions from the graph are true?
i. Water has its maximum density at Q.
ii. The volume of water is greater at 0°C than at 4°C.
iii. The volume of water decreases uniformly when cooled from 100°C.
iv. When water solidifies, its volume increases
i and ii only
i and iii only
ii and iii only
i, ii and iii only
i, ii and iv only
Correct answer is E
No explanation has been provided for this answer.
Similar Questions
The design of the thermostat of an electric iron is based on the ...
In the diagram above, the time taken to trace a wave between P and Q is? ...
What part of a camera functions in a similar way to the retina of the eye? ...
A cube made of metal of linear expansivity α is heated through a temperature θ. If...