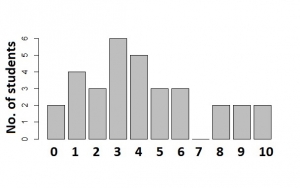
The bar chart shows the distribution of marks scored ...

The bar chart shows the distribution of marks scored by a group of students in a test. Use the chart to answer the question below
How many students took the test?
A.
38
B.
32
C.
15
D.
11
Correct answer is D
2 + 3 + 4 + 5 + 6 + 3 +3 + 0 + 2 + 2 + 2 = 32
Similar Questions
Find the equation whose roots are \(-\frac{2}{3}\) and 3...
Given that (2x - 1)(x + 5) = 2x2 - mx - 5, what is the value of m ...
In the diagram above. |AB| = 12cm, |AE| = 8cm, |DCl = 9cm and AB||DC. Calculate |EC| ...
Simplify \(5\frac{1}{4}\div \left(1\frac{2}{3}- \frac{1}{2}\right)\)...
If 25a2 = 5-1 × 125. Find the value of a?...
Arrange \(\frac{3}{5}\),\(\frac{9}{16}\), \(\frac{34}{59}\) and \(\frac{71}{97}\) in ascending ...