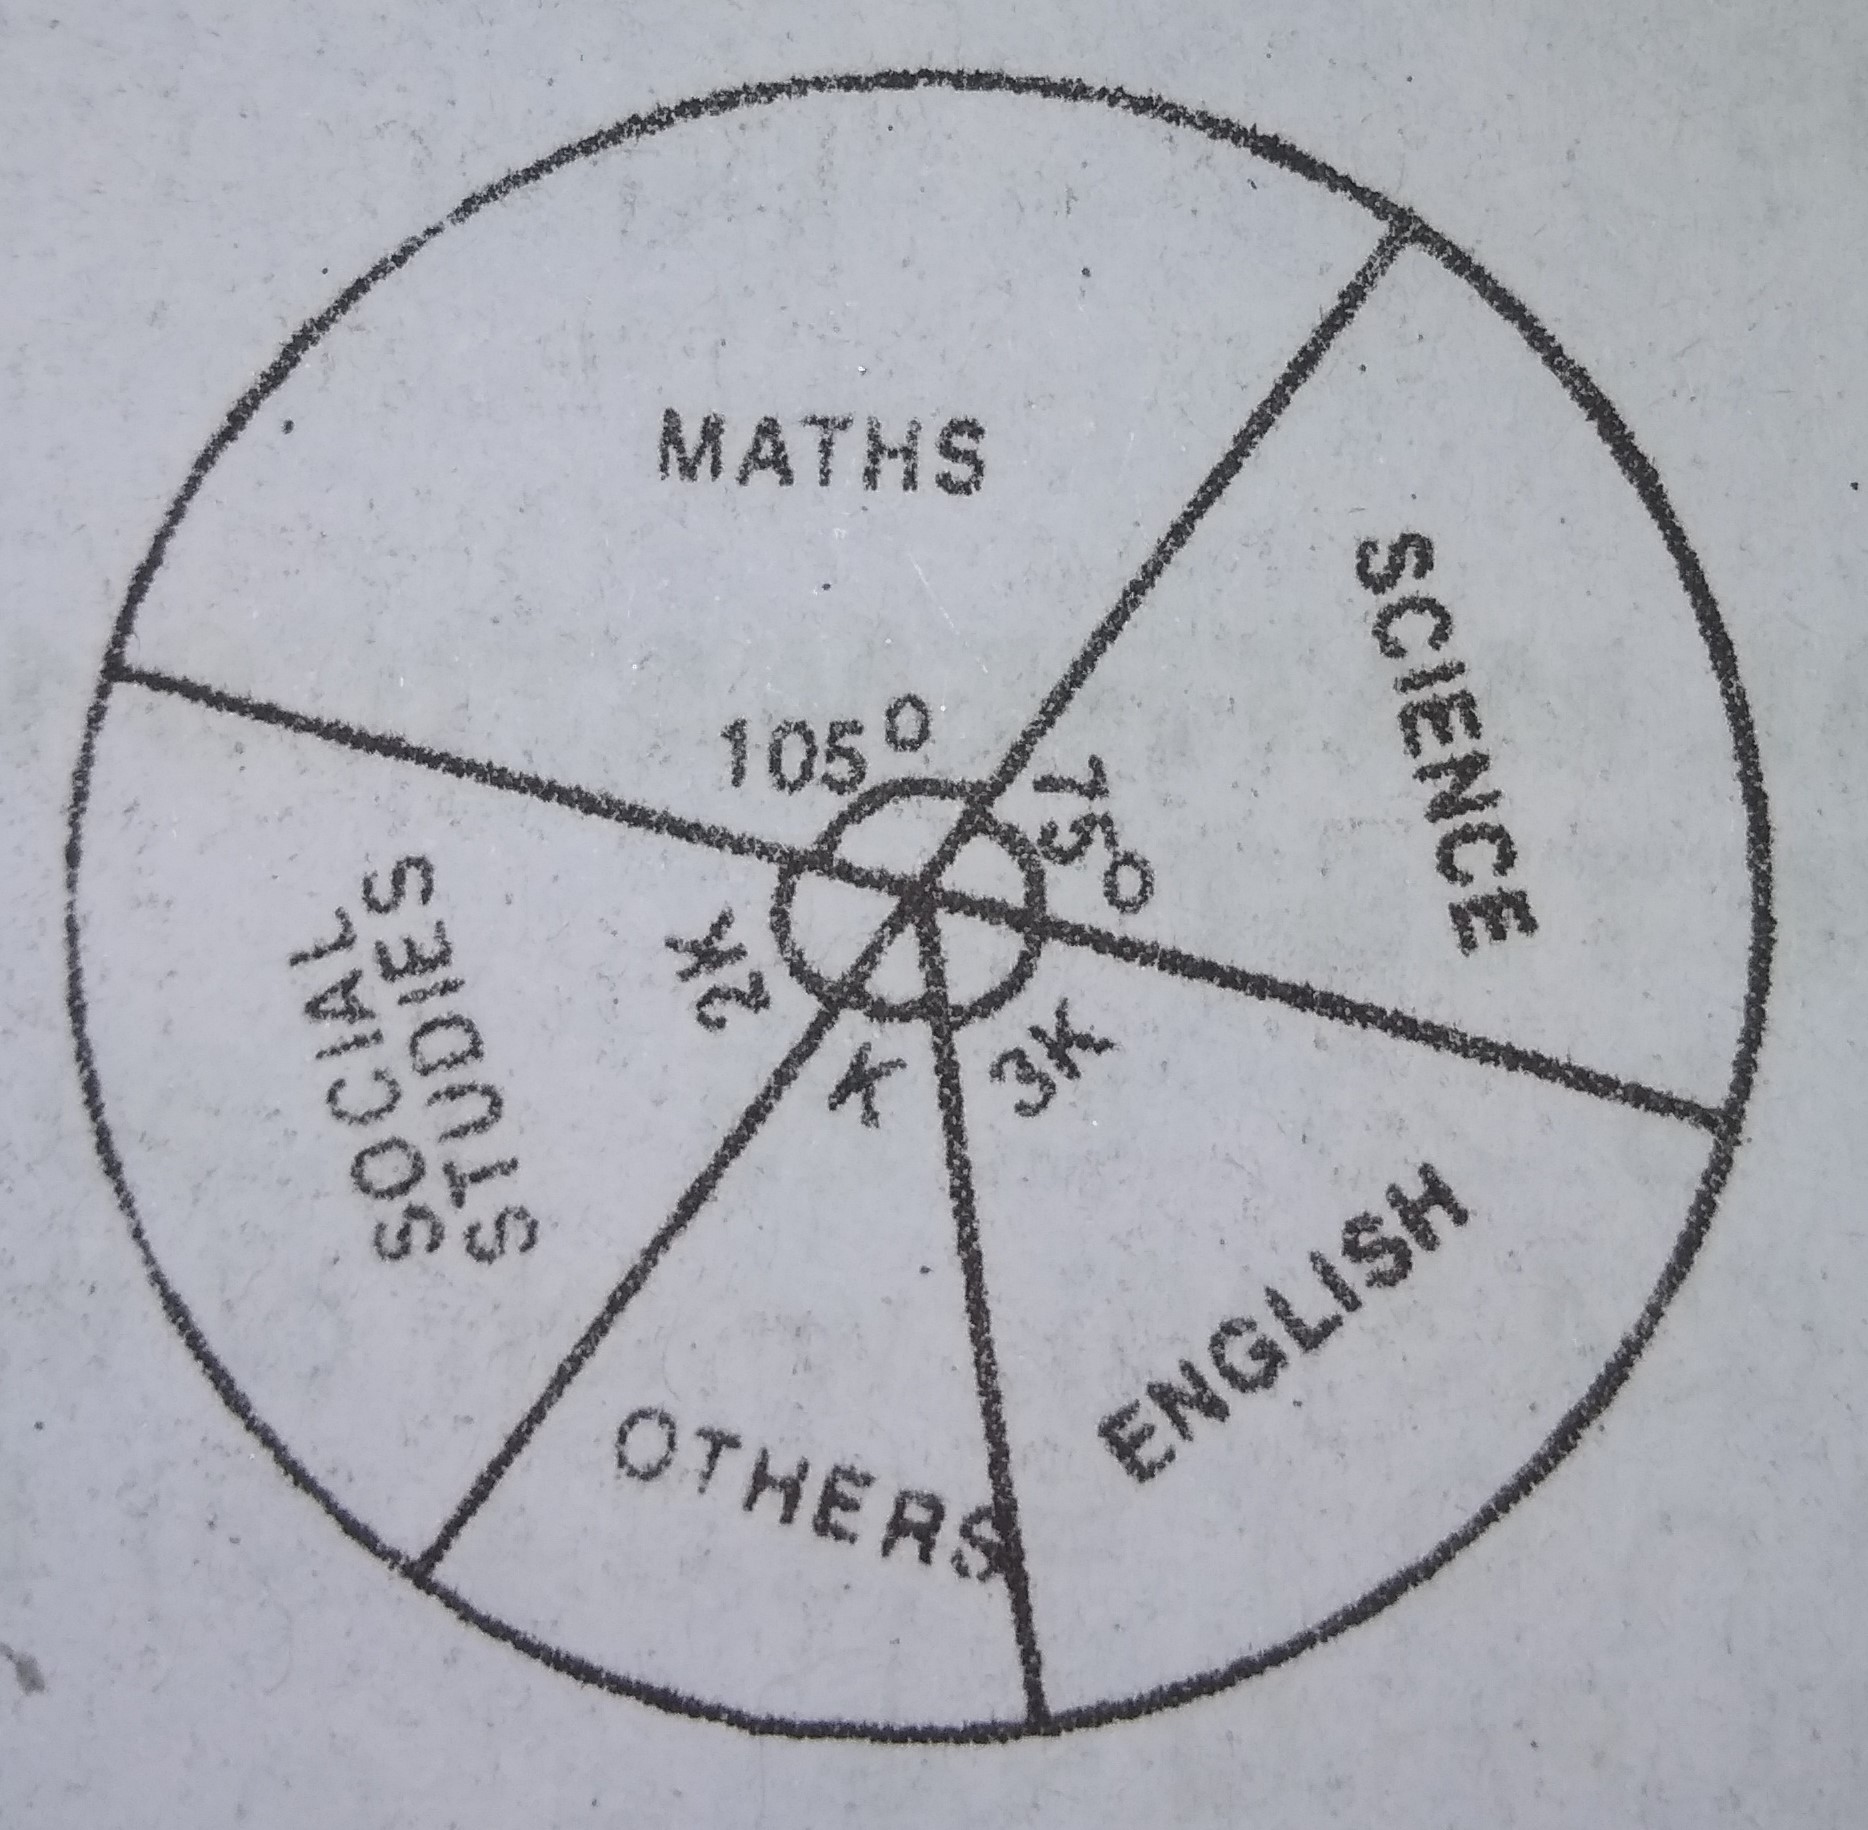
The pie chart illustrate the amount of private time a...

The pie chart illustrate the amount of private time a student spends in a week studying various subjects. use it to answer the question below
If he sends 212 hours week on science, find the total number of hours he studies in a week
313 hours
5 hours
8 hours
12 hours
Correct answer is D
Let x represent the total number of hours spent per week
∴ \frac{75}{360} \times x = \frac{5}{2}
∴ x = \frac{360 \times 5}{725 \times 2}=12 hours
Similar Questions
In a class of 150 students, the sector in a pie chart representing the students offering physic...
The graph given is for the relation y = 2x2 + x - 1.What are the coordinates of the point S?...
Solve: 6(x - 4) + 3(x + 7) = 3 ...
Given that tan x = 5/12, what is the value of sin x + cos x ?...
Convert the decimal number 89 to a binary number ...
The graph represents the relation y = x^2 - 3x - 3. What is the equation of the line of symmetry...