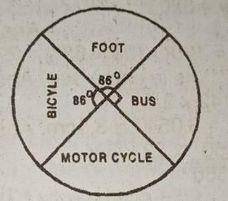
The pie chart above show the distribution of how stud...

The pie chart above show the distribution of how students travelled to a certain school on a particular day. Use this information to answer the question below
If a hundred students travelled by bus, find the total number of students in the school
300
400
500
600
750
Correct answer is B
If X represent the total number of students
where the bus holds a right angle; 90º
\(\frac{90}{360}\times X=100\)(students traveling by bus)
\(X=\frac{100\times 360}{90}=400\)
Similar Questions
What is the volume of this regular three dimensional figure?...
Given that A = {1, 5, 7} B = {3, 9, 12, 15} C = {2, 4, 6, 8} Find (A ∪ B) ∪ C...
Each of the base angles of a isosceles triangle is 58° and the verticles of the triangle li...
If f(x) = 2(x - 3)\(^2\) + 3(x - 3) + 4 and g(y) = \(\sqrt{5 + y}\), find g [f(3)] and f[g(4)]....
In the diagram, \(\frac{PQ}{RS}\), find xo + yo...
In the diagram, KS is a tangent to the circle centre O at R and ∠ROQ = 80°. Find ∠QRS. ...
What is the volume of a cube if the diagonal of one of the sides is \(\sqrt{50}\)cm?...