
Data Interpretation questions and answers

Data Interpretation Questions and Answers

Data Interpretation questions test one's ability in analysing data, inspecting the elements in data and interpreting them to extract maximum information from the given set of data or information. The data is usually given in the form of charts, tables and graphs.

Practise with our Data Interpretation questions and answers to help you know what to expect, improve your speed and confidence and be really prepared for the actual test.
81.

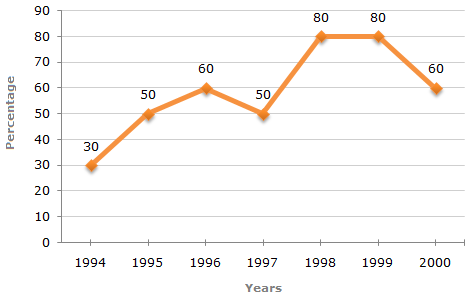
The following line graph gives the percentage of the number of candidates who qualified for an examination out of the total number of candidates who appeared for the examination over a period of seven years from 1994 to 2000.

Percentage of Candidates who Qualified to Appeared in an Examination Over the Years

In which pair of years was the number of candidates who qualified, the same?

A.

1995 and 1997

B.

1995 and 2000

C.

1998 and 1999

D.

Data inadequate

Correct answer is D

The graph gives the data for the percentage of candidates qualified to appeared and unless the absolute values of number of candidates qualified or candidates appeared is know we cannot compare the absolute values for any two years.

Hence, the data is inadequate to solve this question.

82.

The following line graph gives the percentage of the number of candidates who qualified for an examination out of the total number of candidates who appeared for the examination over a period of seven years from 1994 to 2000.

Percentage of Candidates who Qualified to Appeared in an Examination Over the Years

The difference between the percentage of candidates qualified and candidates who appeared was maximum in which of the following pair of years?

A.

1994 and 1995

B.

1997 and 1998

C.

1998 and 1999

D.

1999 and 2000

Correct answer is B

The differences between the percentages of candidates qualified to appeared for the give pairs of years are:

For 1994 and 1995 = 50 - 30 = 20.

For 1998 and 1999 = 80 - 80 = 0.

For 1994 and 1997 = 50 - 30 = 20.

For 1997 and 1998 = 80 - 50 = 30.

For 1999 and 2000 = 80 - 60 = 20.

Thus, the maximum difference is between the years 1997 and 1998.

83.

The following line graph gives the percent profit earned by two Companies X and Y during the period 1996 - 2001.

Percentage profit earned by Two Companies X and Y over the Given Years

%Profit = ((Income - Expenditure) / Expenditure) x 100

If the incomes of the two Companies were equal in 1999, then what was the ratio of expenditure of Company X to that of Company Y in 1999 ?

A.

6:5

B.

5:6

C.

11:6

D.

16:15

Correct answer is D

Let the incomes of each of the two Companies X and Y in 1999 be Rs. x.

And let the expenditures of Companies X and Y in 1999 be E1 and E2 respectively.

Then, for Company X we have:

50 = (x - E1)/E1 x 100 => 50/100 = (x/E1) - 1 => x = 150/100 E1 .... (i)

Also, for Company Y we have:

60 = (x - E2)/E2 x 100 => 60/100 = (x/E2) - 1 => x = 160/100 E2 .... (ii)

From (i) and (ii), we get:

150/100 E1 = 160/100 E2 => E1/E2 = 160/150 = 16/15 (Required ratio)

84.

The following line graph gives the percent profit earned by two Companies X and Y during the period 1996 - 2001.

Percentage profit earned by Two Companies X and Y over the Given Years

%Profit = ((Income - Expenditure) / Expenditure) x 100

The expenditure of Company X in the year 1998 was Rs. 200 crores and the income of company X in 1998 was the same as its expenditure in 2001. The income of Company X in 2001 was ?

A.

Rs. 465 crores

B.

Rs. 385 crores

C.

Rs. 335 crores

D.

Rs. 295 crores

Correct answer is A

Let the income of Company X in 1998 be Rs. x crores.

Then, 55 = (x - 200)/200 x 100  =>  x = 310

Therefore Expenditure of Company X in 2001 = Income of Company X in 1998

= Rs. 310 crores.

Let the income of Company X in 2001 be Rs. z crores.

Then, 50 = (z - 310)/310 x 100 => z = 465

Therefore Income of Company X in 2001 = Rs. 465 crores.

85.

The following line graph gives the percent profit earned by two Companies X and Y during the period 1996 - 2001.

Percentage profit earned by Two Companies X and Y over the Given Years

%Profit = ((Income - Expenditure) / Expenditure) x 100

If the expenditures of Company X and Y in 1996 were equal and the total income of the two Companies in 1996 was Rs. 342 crores, what was the total profit of the two Companies together in 1996 ? (Profit = Income - Expenditure)

A.

Rs. 240 crores

B.

Rs. 171 crores

C.

Rs. 120 crores

D.

Rs. 102 crores

Correct answer is D

Let the expenditures of each companies X and Y in 1996 be Rs. x crores.

And let the income of Company X in 1996 be Rs. z crores.

So that the income of Company Y in 1996 = Rs. (342 - z) crores.

Then, for Company X we have:

40 = (z - x)/x x 100  =>  40/100 = z/x - 1  =>  x = 100z/140 .... (i)

Also, for Company Y we have: 45 = ((342 - z)/x) x 100  =>  45/100 = ((342 - z)/x) - 1 => x = ((342 - z) x 100)/145 .... (ii) 

From (i) and (ii), we get:

100z/140 = ((342 - z) x 100)/145 => z = 168

Substituting z = 168 in (i), we get : x = 120.

Therefore Total expenditure of Companies X and Y in 1996 = 2x = Rs. 240 crores.

Total income of Companies X and Y in 1996 = Rs. 342 crores.

Therefore Total profit = Rs. (342 - 240) crores = Rs. 102 crores.